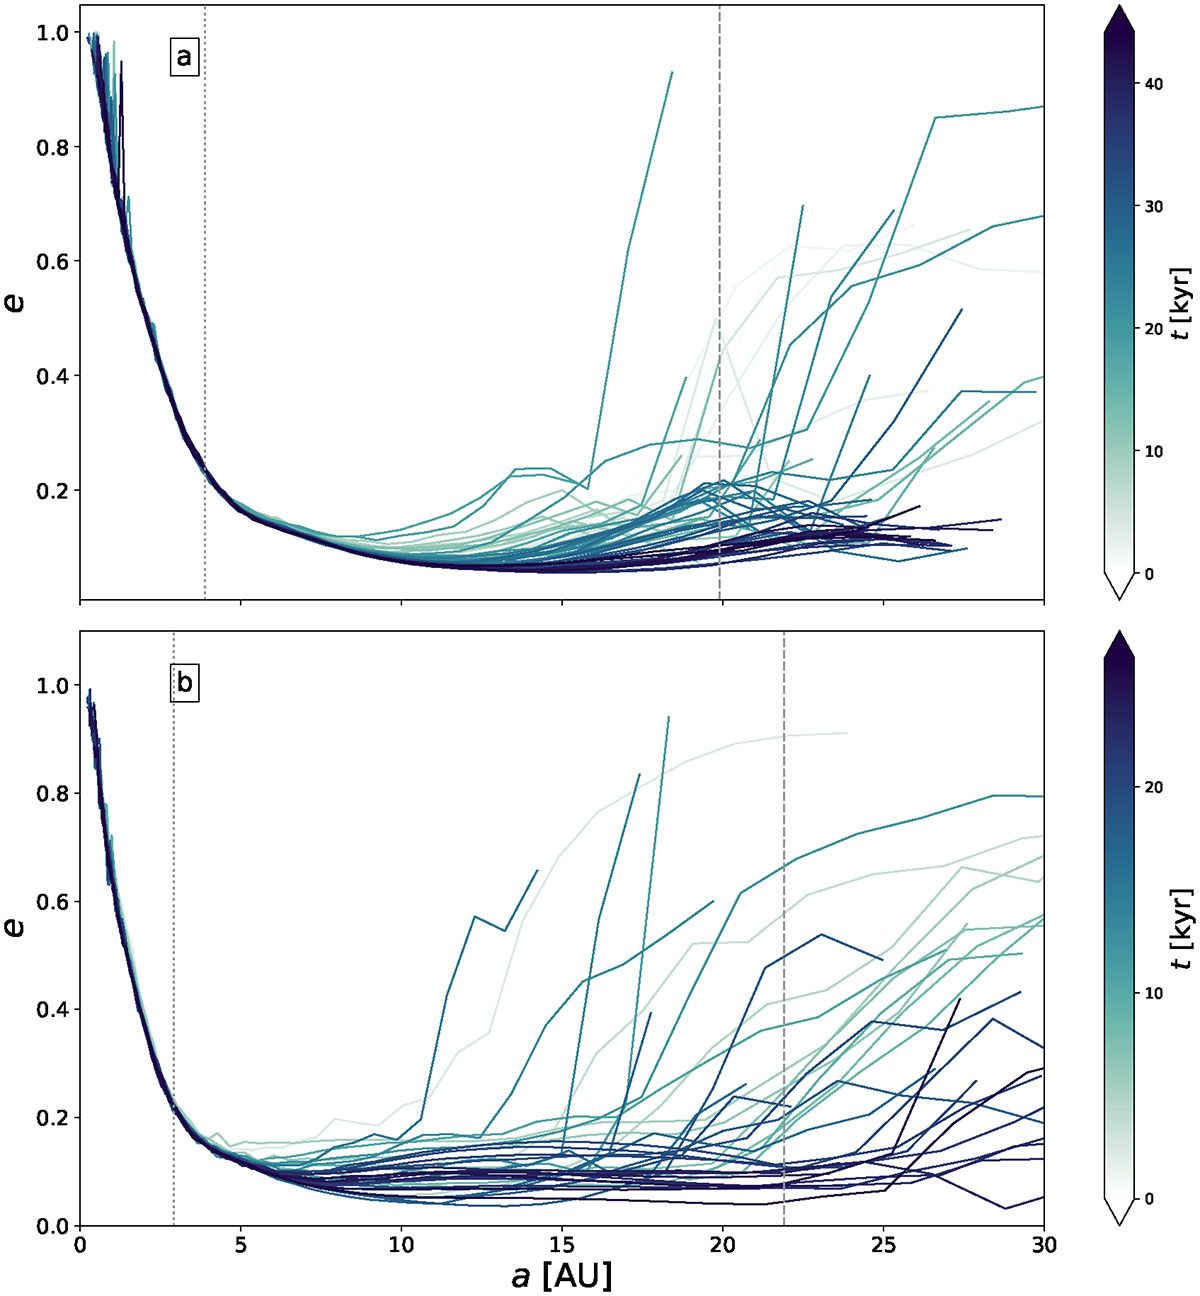
Fig. 10.
Download original image
Distribution of eccentricity, computed from the disk kinematics (Eqs. 5 and 6), for run R1 (a) and run R2 (b). Each curve represents a different time, with t = 0 marking the epoch of sink formation. The dashed line indicates the largest radius enclosing 90% of the disk mass over the entire simulation. The sink accretion radius is indicated by the dotted line.
Current usage metrics show cumulative count of Article Views (full-text article views including HTML views, PDF and ePub downloads, according to the available data) and Abstracts Views on Vision4Press platform.
Data correspond to usage on the plateform after 2015. The current usage metrics is available 48-96 hours after online publication and is updated daily on week days.
Initial download of the metrics may take a while.