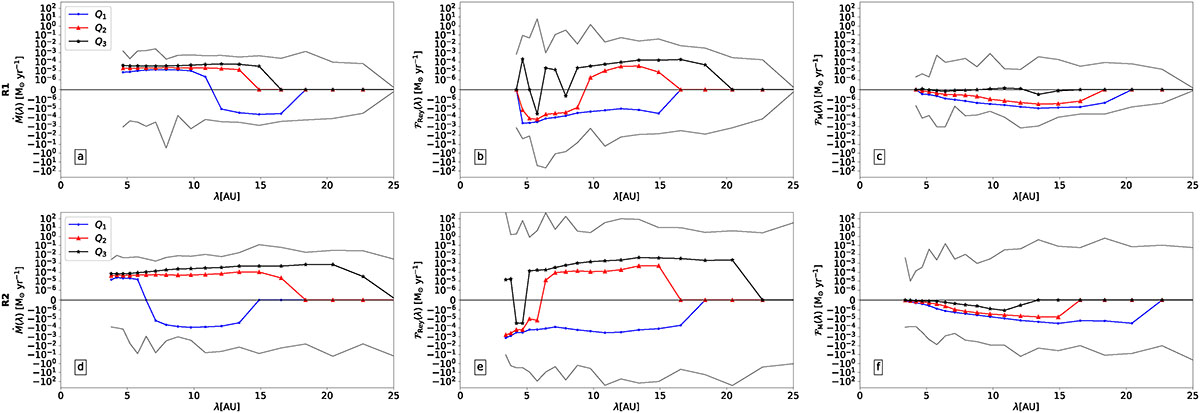
Fig. 12.
Download original image
Internal kinematics of the disk. Shown here are the orbital mass accretion rate (a and d), turbulent stress tensor induced accretion rate (b and e), and Maxwell stress tensor induced accretion rate (c and f) for runs R1 (first row) and R2 (second row), computed as described in Sect. 5.2. These are computed in fixed logarithmic bins in λ throughout all simulation snapshots using only cells belonging to the disk, and we display the resulting first (blue), second (red), and third (black) quantiles, which respectively represent the 25th, 50th, and 75th percentiles. The gray curves in each plot represent minimal and maximal values.
Current usage metrics show cumulative count of Article Views (full-text article views including HTML views, PDF and ePub downloads, according to the available data) and Abstracts Views on Vision4Press platform.
Data correspond to usage on the plateform after 2015. The current usage metrics is available 48-96 hours after online publication and is updated daily on week days.
Initial download of the metrics may take a while.