Open Access
Fig. 14.
Download original image
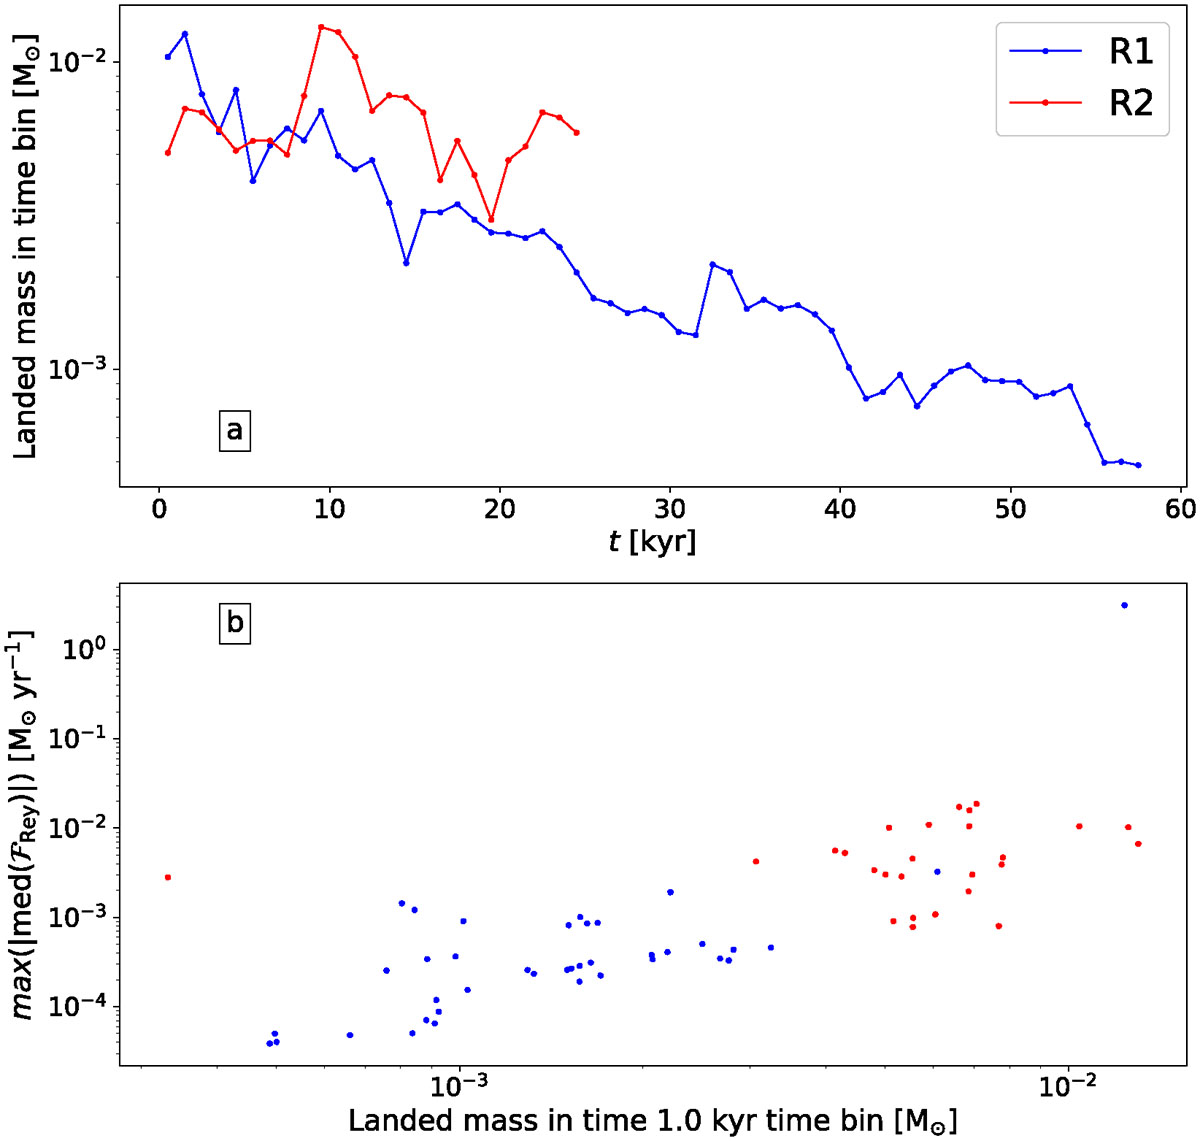
Correlation between vertical accretion and turbulent stress in runs R1 (blue) and R2 (red). Panel (a): Mass accreted vertically onto the disk, shown in 1 kyr bins. Panel (b): Maximum median accretion rate within each bin, plotted against the corresponding accreted mass.
Current usage metrics show cumulative count of Article Views (full-text article views including HTML views, PDF and ePub downloads, according to the available data) and Abstracts Views on Vision4Press platform.
Data correspond to usage on the plateform after 2015. The current usage metrics is available 48-96 hours after online publication and is updated daily on week days.
Initial download of the metrics may take a while.