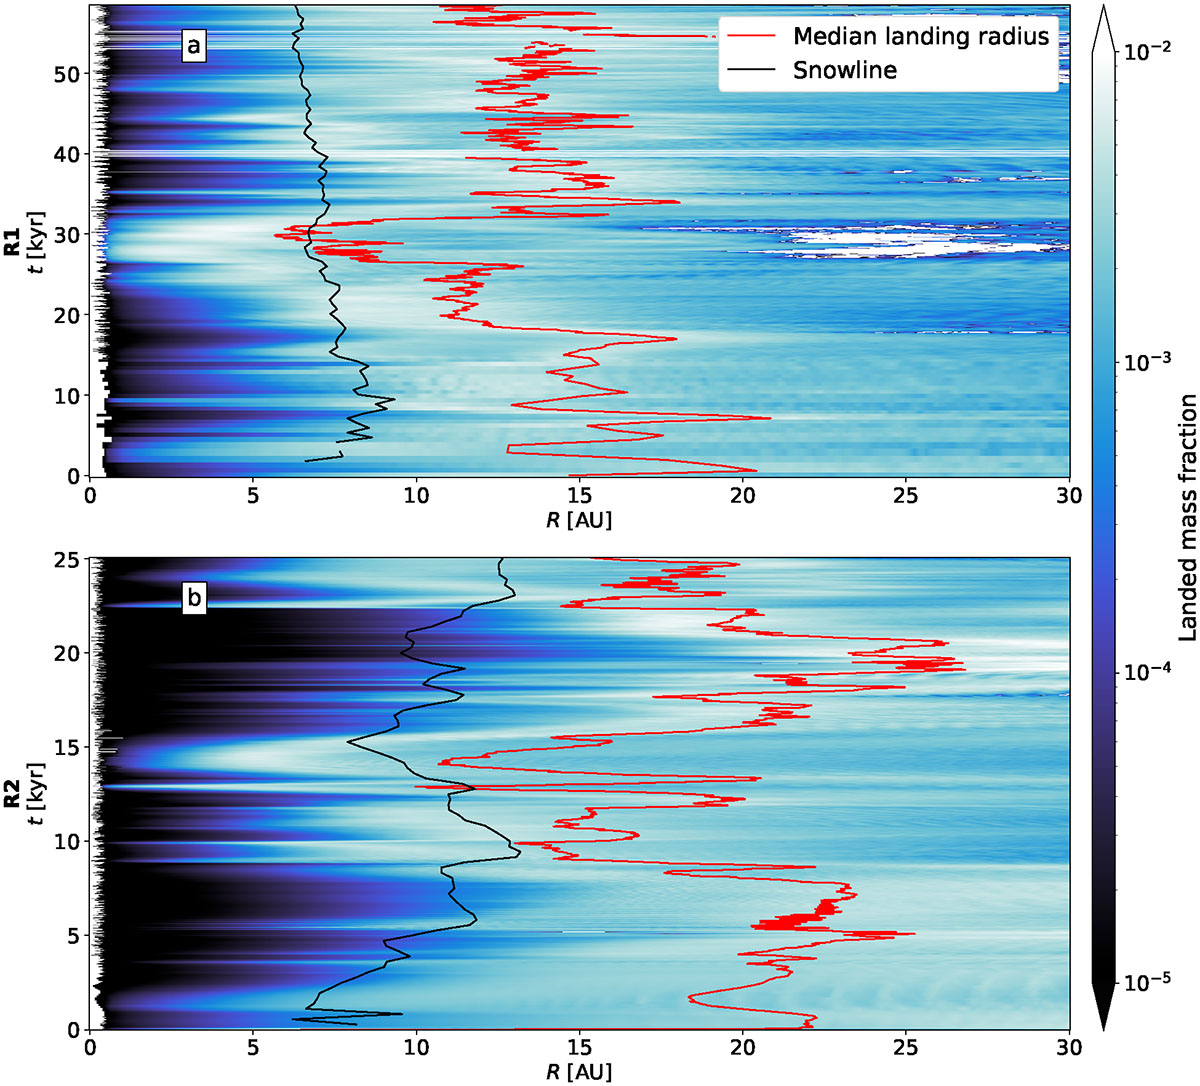
Fig. 15.
Download original image
Temporal evolution of the fraction of mass landing at each radius, obtained by normalizing the incoming mass flux from Eq. (4) for each snapshot, for run R1 (a) and run R2 (b). The red curve indicates the median landing radius, where half of the mass lands at larger radii and half at smaller radii. The black curve indicates the location of the snow line. An animated movie, which combines panel (b) with a 3D volume render of the disk of run R2, is available at the CDS.
Current usage metrics show cumulative count of Article Views (full-text article views including HTML views, PDF and ePub downloads, according to the available data) and Abstracts Views on Vision4Press platform.
Data correspond to usage on the plateform after 2015. The current usage metrics is available 48-96 hours after online publication and is updated daily on week days.
Initial download of the metrics may take a while.