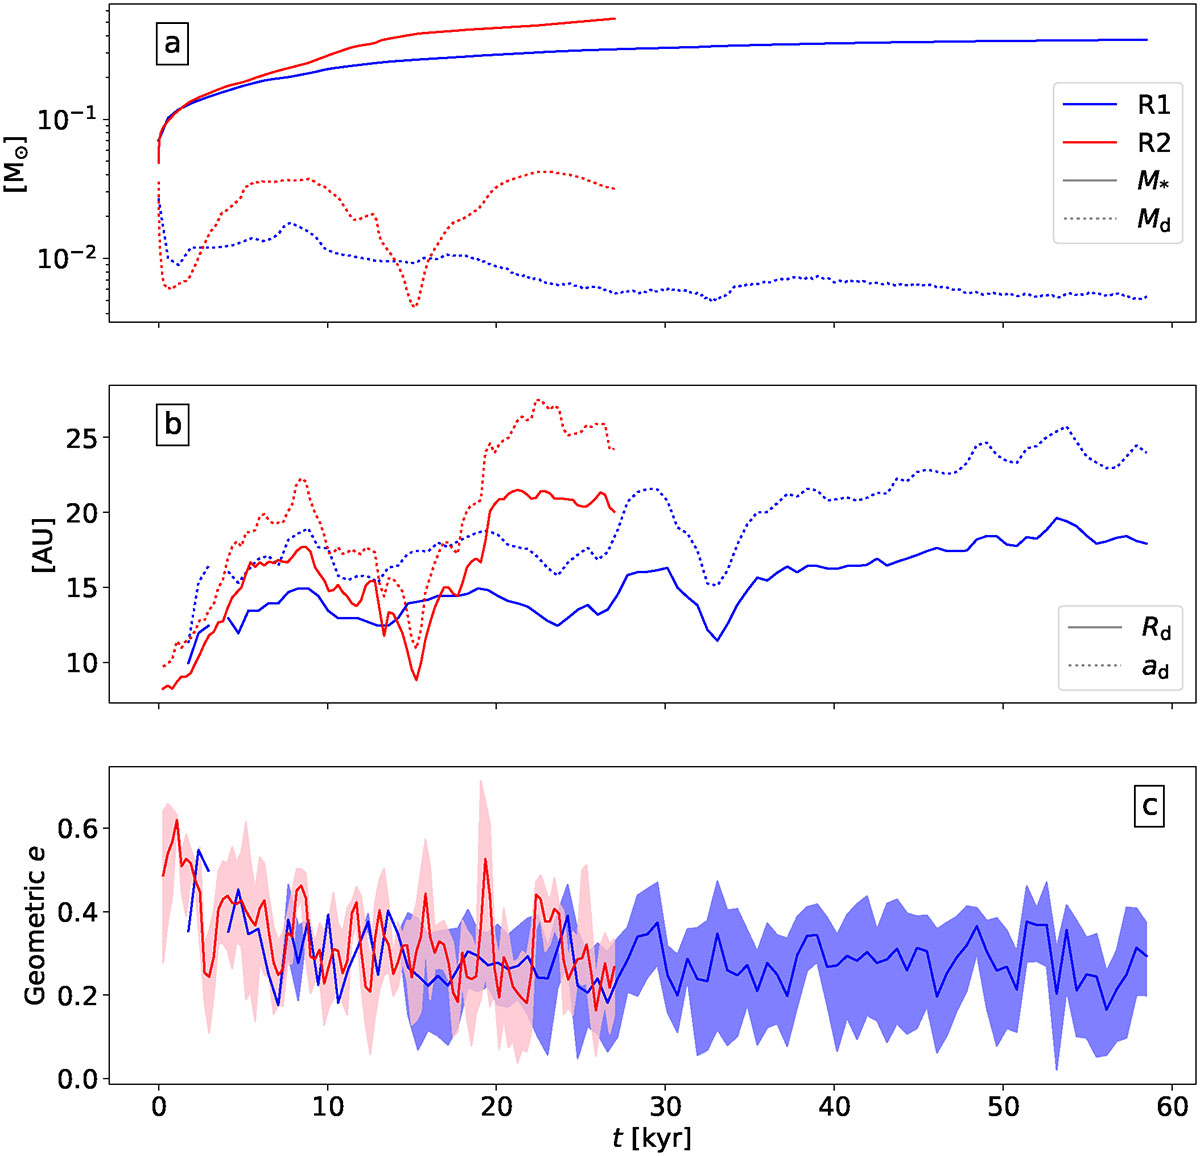
Fig. 2.
Download original image
Global evolution of the protoplanetary disk as a function of time, where t = 0 represents the epoch of sink (i.e., protostellar) formation. The quantities shown are the protostellar mass (solid lines in panel a), disk mass (dotted lines in panel a), disk radius (solid lines in panel b), disk semimajor axis (dotted lines in panel b), and apparent disk eccentricity (c). The disk semimajor axis and apparent eccentricity are inferred from an elliptical fit. The blue (red) curve corresponds to the 1 M⊙ (3 M⊙) run R1 (R2). The shaded regions in panel (d) represent temporal fluctuations in the measurement, and the solid line is an average value.
Current usage metrics show cumulative count of Article Views (full-text article views including HTML views, PDF and ePub downloads, according to the available data) and Abstracts Views on Vision4Press platform.
Data correspond to usage on the plateform after 2015. The current usage metrics is available 48-96 hours after online publication and is updated daily on week days.
Initial download of the metrics may take a while.