Open Access
Fig. D.1.
Download original image
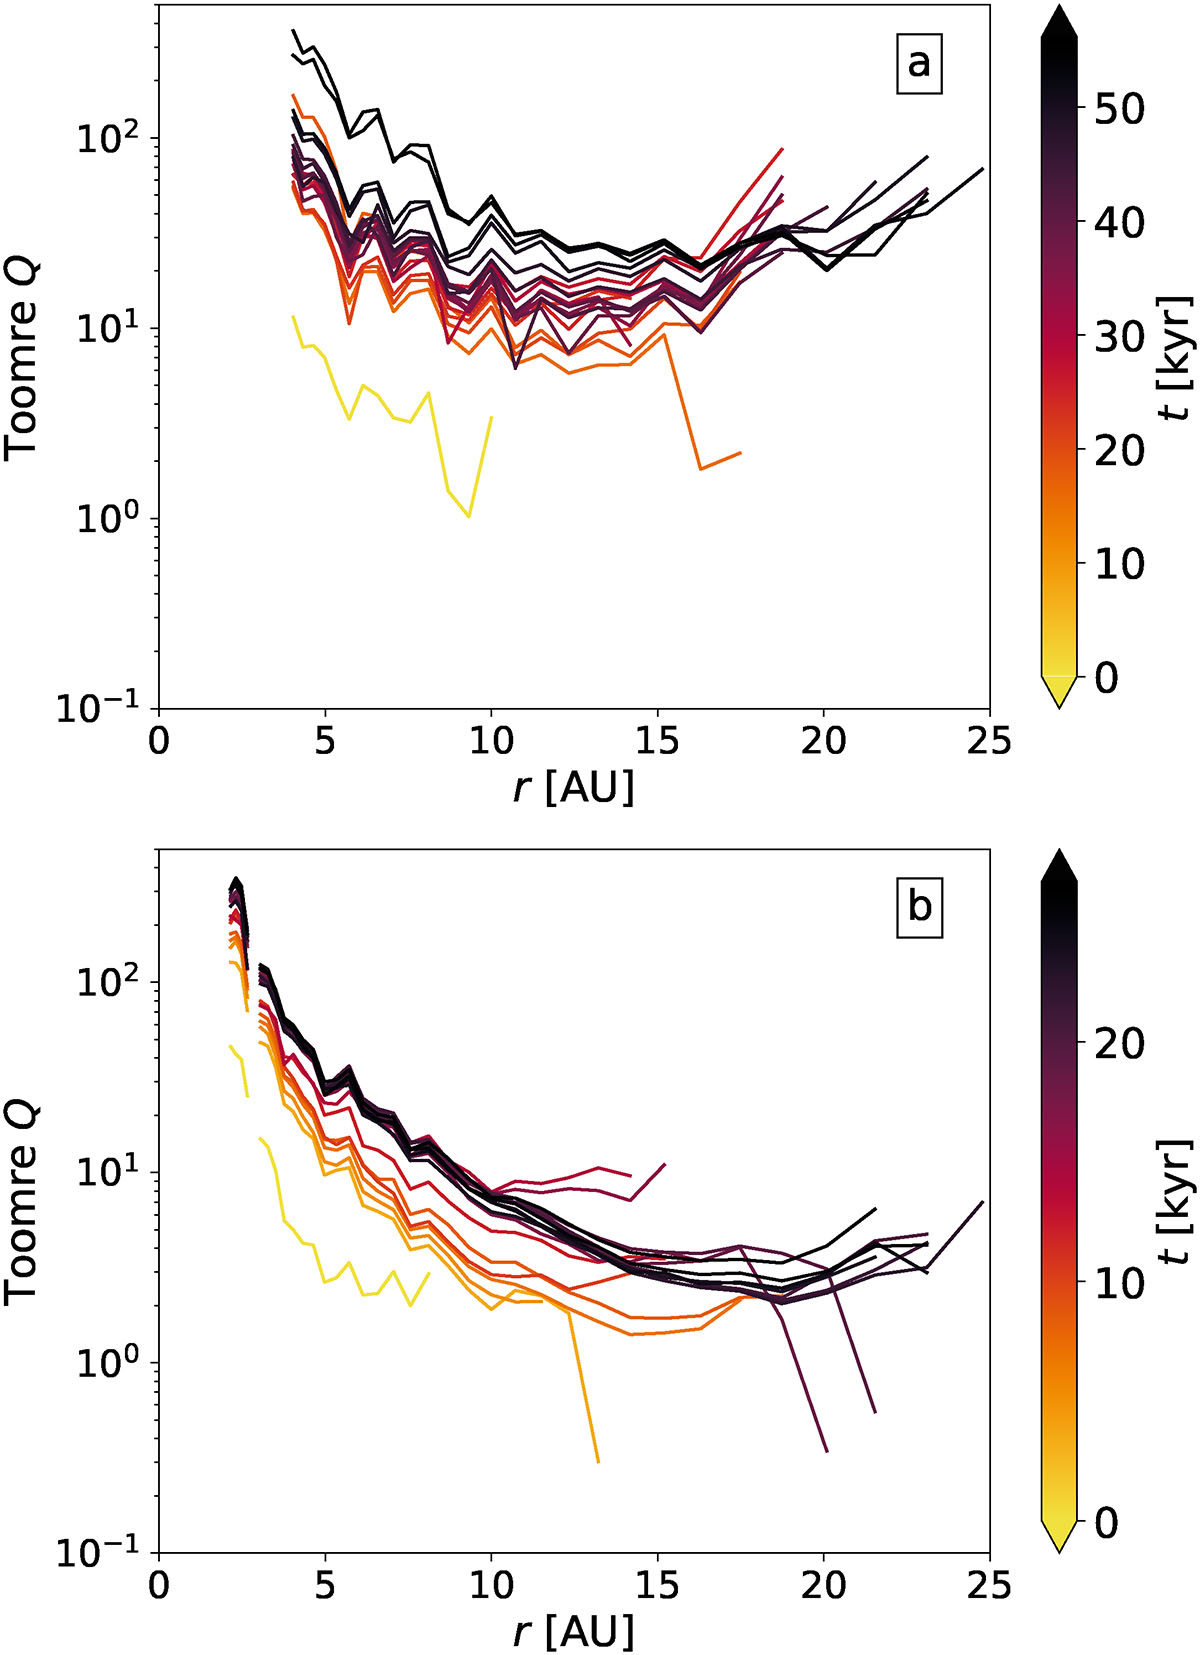
Averaged values of the real part of Toomre Q for runs R1 (a) and R2 (b) as a function of radius. Each curve corresponds to a different time, with t = 0 denoting the moment of sink formation. Only cells belonging to the disk were used when computing these curves.
Current usage metrics show cumulative count of Article Views (full-text article views including HTML views, PDF and ePub downloads, according to the available data) and Abstracts Views on Vision4Press platform.
Data correspond to usage on the plateform after 2015. The current usage metrics is available 48-96 hours after online publication and is updated daily on week days.
Initial download of the metrics may take a while.