Open Access
Fig. E.1.
Download original image
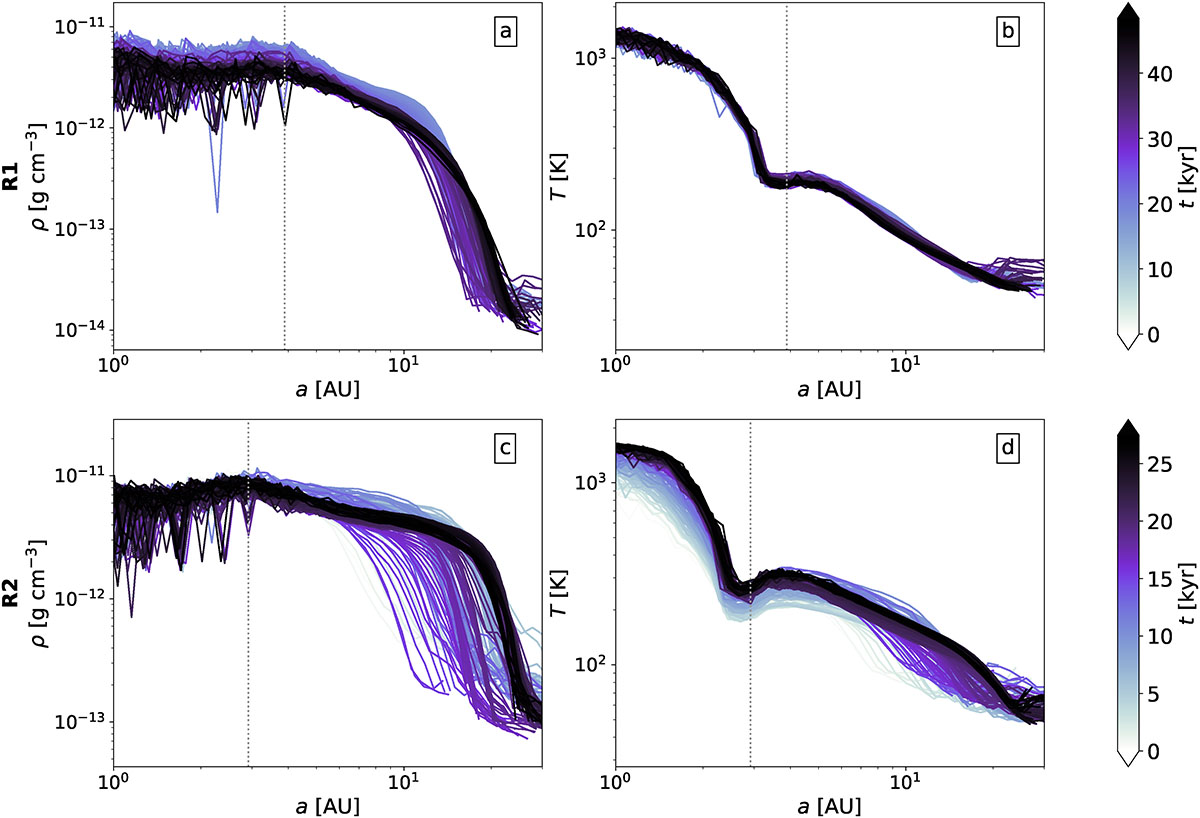
Mass-weighted averages of the disk density (a and c) and temperature (b and d) for runs R1 (a and b) and R2 (c and d). Each curve denotes a different time, with t = 0 corresponding to the moment of sink formation. The vertical dotted gray lines correspond to the accretion radius of the sink particle.
Current usage metrics show cumulative count of Article Views (full-text article views including HTML views, PDF and ePub downloads, according to the available data) and Abstracts Views on Vision4Press platform.
Data correspond to usage on the plateform after 2015. The current usage metrics is available 48-96 hours after online publication and is updated daily on week days.
Initial download of the metrics may take a while.