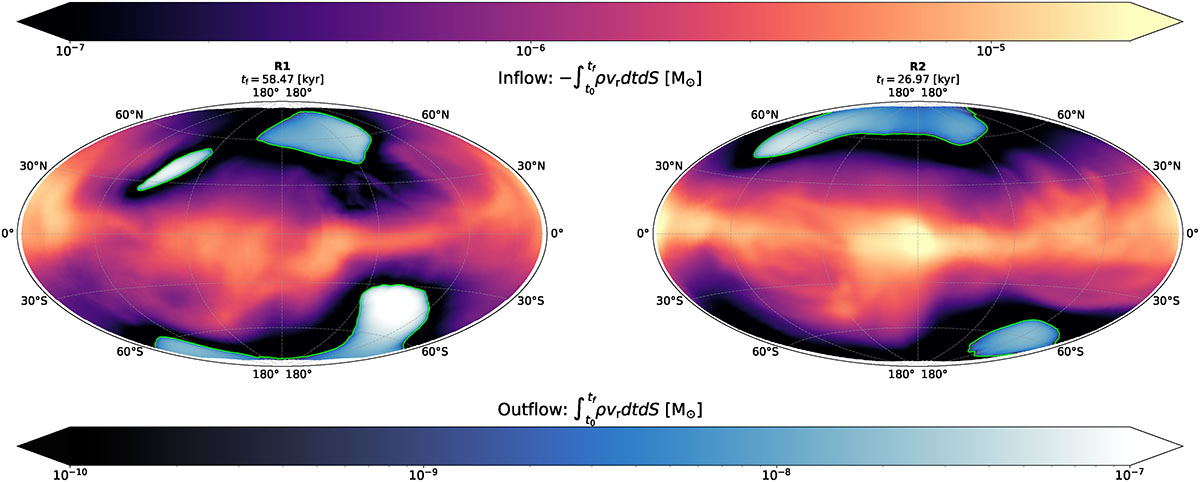
Fig. 3.
Download original image
Hammer projections displaying the time and surface integrated radial mass flux on a sphere of Rshell = 30 AU for runs R1 (left) and R2 (right), displaying both the inflow (top colorbar) and outflow (bottom colorbar) of material throughout the simulation’s duration post-sink formation (tf), computed by integrating Eq. (1) in time. The lime colored contour delimitates the transition from positive to negative values.
Current usage metrics show cumulative count of Article Views (full-text article views including HTML views, PDF and ePub downloads, according to the available data) and Abstracts Views on Vision4Press platform.
Data correspond to usage on the plateform after 2015. The current usage metrics is available 48-96 hours after online publication and is updated daily on week days.
Initial download of the metrics may take a while.