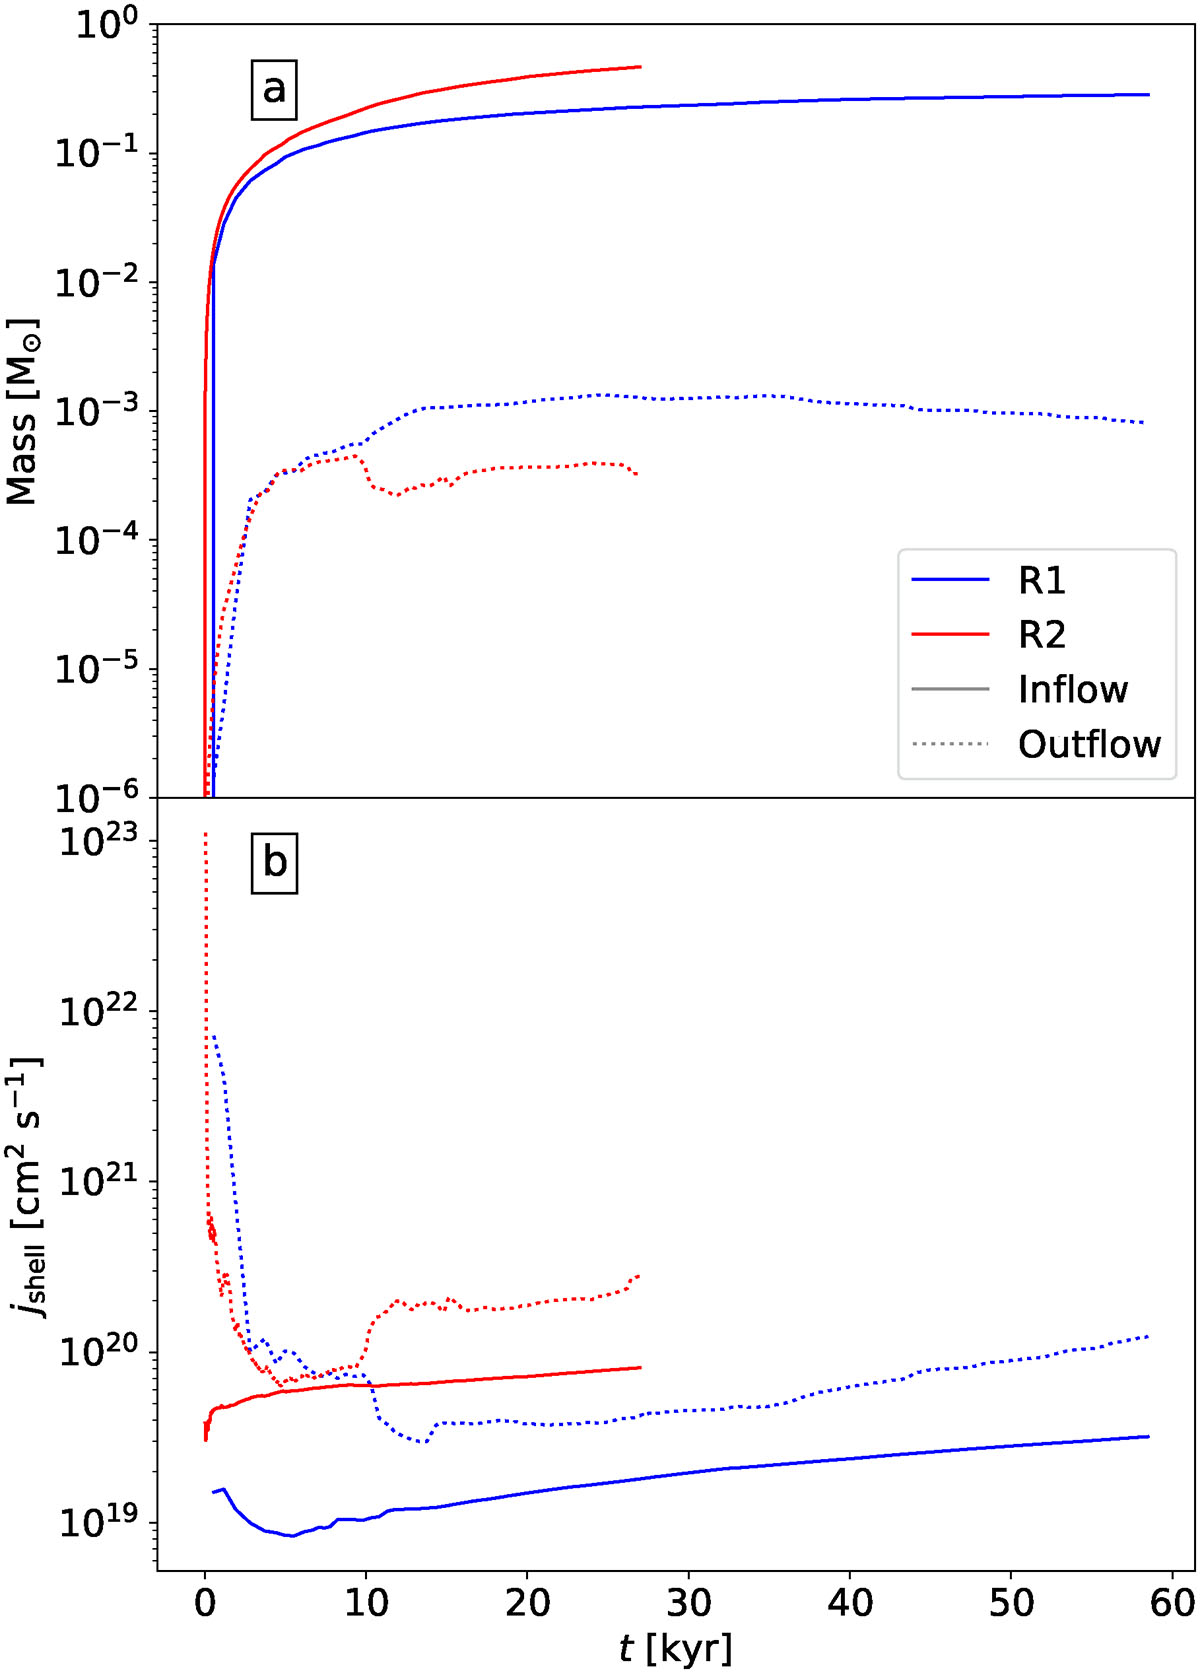
Fig. 4.
Download original image
Total inflow (solid lines) and outflow (dotted lines) of mass (panel a) and specific angular momentum (panel b) through a sphere of radius Rshell = 30 AU around the sink particle as a function of time, where t = 0 corresponds to the epoch of sink formation, for runs R1 (blue) and R2 (red). This figure is complementary to Fig. 3.
Current usage metrics show cumulative count of Article Views (full-text article views including HTML views, PDF and ePub downloads, according to the available data) and Abstracts Views on Vision4Press platform.
Data correspond to usage on the plateform after 2015. The current usage metrics is available 48-96 hours after online publication and is updated daily on week days.
Initial download of the metrics may take a while.