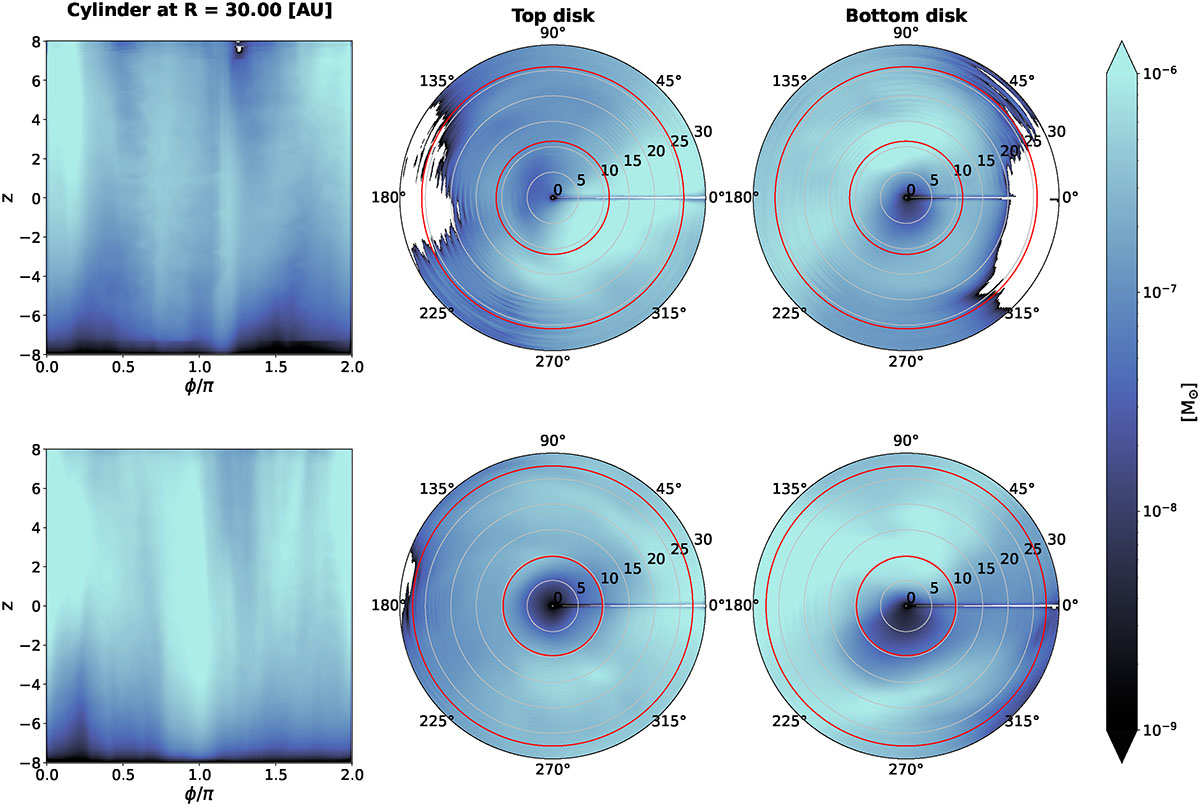
Fig. 5.
Download original image
Total inflow of material through a cylinder of radius Rshell = 30 AU and height h = 16 AU throughout the simulation’s duration post-sink formation for runs R1 (≈58 kyr, first row) and R2 (≈27 kyr, second row), computed by integrating Eq. (3) (first column) and Eq. (4) (second and third columns) in time. The red circles in the second and third columns correspond to the minimum and maximum semimajor axis of the disk throughout each simulation’s duration, and thus represent the locations where material has landed in the disk.
Current usage metrics show cumulative count of Article Views (full-text article views including HTML views, PDF and ePub downloads, according to the available data) and Abstracts Views on Vision4Press platform.
Data correspond to usage on the plateform after 2015. The current usage metrics is available 48-96 hours after online publication and is updated daily on week days.
Initial download of the metrics may take a while.