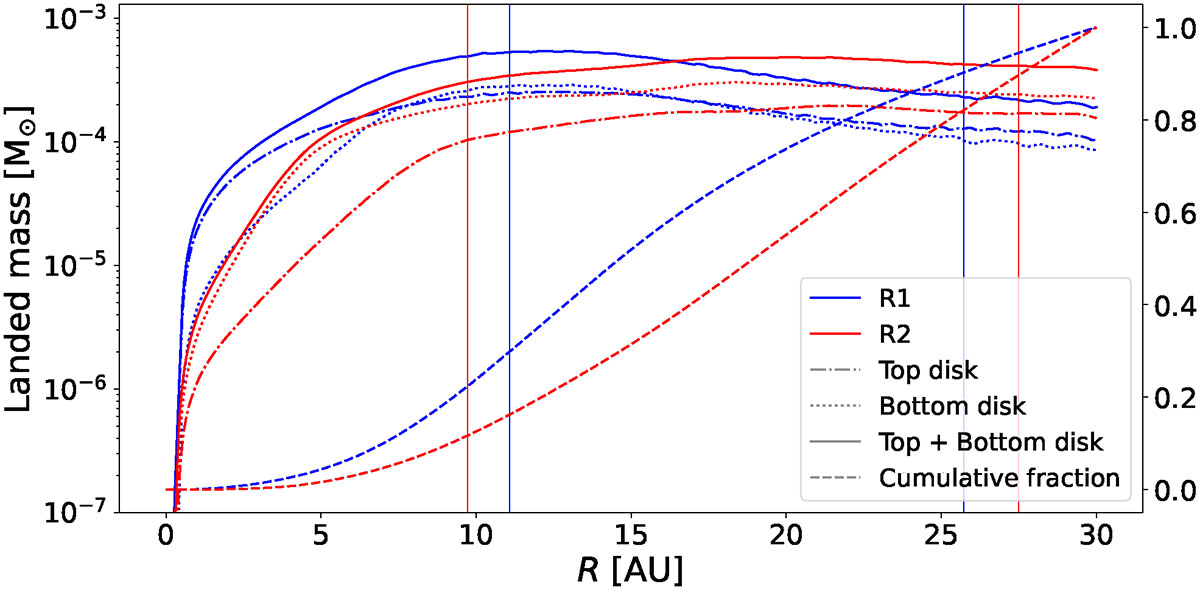
Fig. 6.
Download original image
Vertical mass accretion onto the disk for runs R1 (blue) and R2 (red), obtained by integrating Eq. (4) over ϕ and time. Dash-dotted and dotted lines show accretion through the top (z = 8 AU) and bottom (z = −8 AU) surfaces, respectively; the solid lines are their sum. Solid vertical lines mark the disk’s minimum and maximum radii during the simulation. The dashed lines represent the cumulative fraction of landed mass (normalized to unity), plotted against the right-hand axis. This figure is complementary to Fig. 5.
Current usage metrics show cumulative count of Article Views (full-text article views including HTML views, PDF and ePub downloads, according to the available data) and Abstracts Views on Vision4Press platform.
Data correspond to usage on the plateform after 2015. The current usage metrics is available 48-96 hours after online publication and is updated daily on week days.
Initial download of the metrics may take a while.