Fig. 1
Download original image
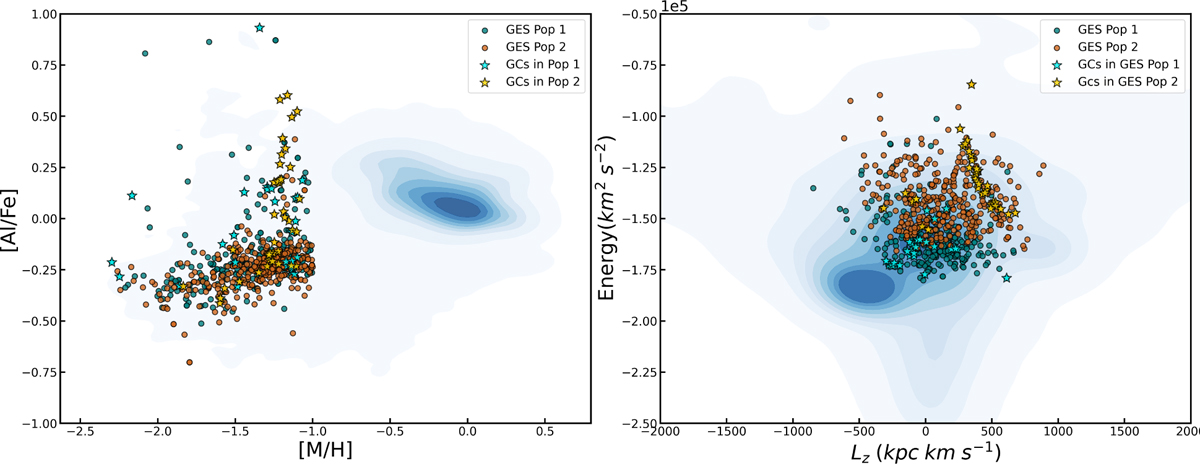
Left panel: [Al/Fe] versus [M/H] for the whole APOGEE dataset, inclusive of disc (blue contours). Pop 1 and Pop 2 from this work are highlighted in green and orange and individual stars in globular clusters are represented as light blue and yellow stars for the two populations respectively. Right panel: energy versus angular momentum for the APOGEE halo (blue contours). Pop 1 and Pop 2 from this work are highlighted in green and orange and individual stars in globular clusters are represented as light blue and yellow stars for the two populations respectively.
Current usage metrics show cumulative count of Article Views (full-text article views including HTML views, PDF and ePub downloads, according to the available data) and Abstracts Views on Vision4Press platform.
Data correspond to usage on the plateform after 2015. The current usage metrics is available 48-96 hours after online publication and is updated daily on week days.
Initial download of the metrics may take a while.