Fig. 6
Download original image
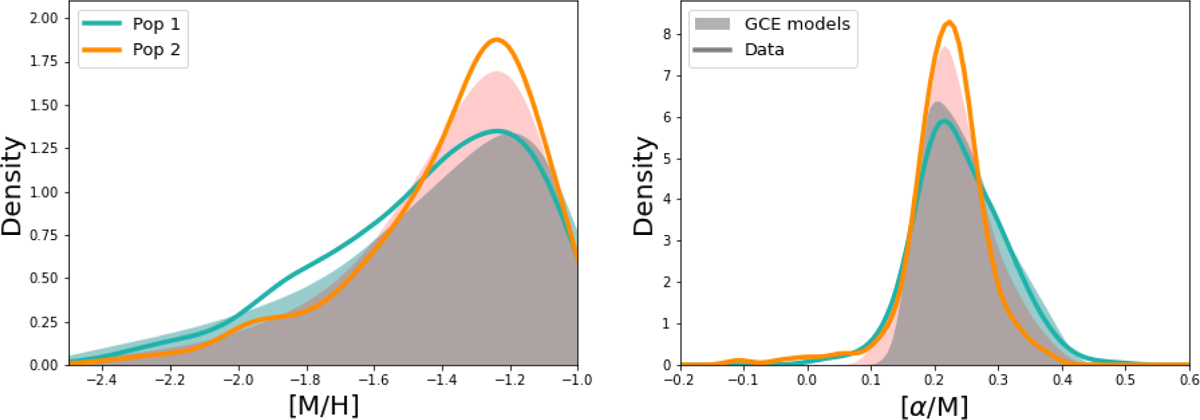
Kernel density estimations for observed stellar distribution functions for Pop 1 and Pop 2 as discussed in Section 2 (green and orange solid lines, respectively) as compared with predictions from the two correspondent best models (green and orange filled areas). Left panel: metallicity distribution function; right panel: [α/M] distribution function.
Current usage metrics show cumulative count of Article Views (full-text article views including HTML views, PDF and ePub downloads, according to the available data) and Abstracts Views on Vision4Press platform.
Data correspond to usage on the plateform after 2015. The current usage metrics is available 48-96 hours after online publication and is updated daily on week days.
Initial download of the metrics may take a while.