Fig. 12
Download original image
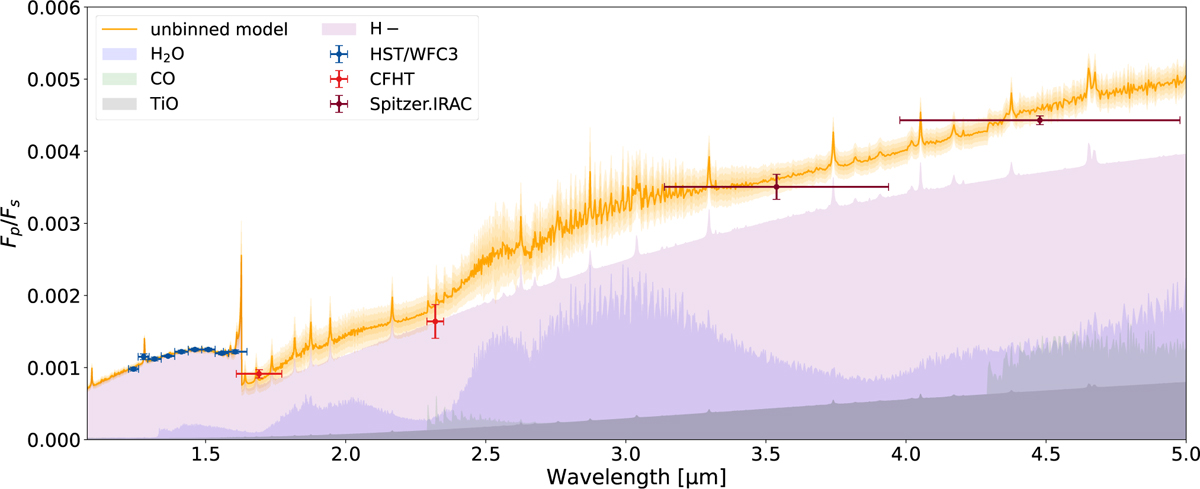
Best-fit FREE model spectrum together with the data points from HST, CFHT, and Spitzer shown in filled dots with error bars and distinct colors. The orange curve and surrounding shaded region represent the best-fit model and its 3σ regime. The shaded areas in different colors below the orange curve indicate the reference models containing only H2O, CO, TiO, or H−, respectively.
Current usage metrics show cumulative count of Article Views (full-text article views including HTML views, PDF and ePub downloads, according to the available data) and Abstracts Views on Vision4Press platform.
Data correspond to usage on the plateform after 2015. The current usage metrics is available 48-96 hours after online publication and is updated daily on week days.
Initial download of the metrics may take a while.