Fig. 7
Download original image
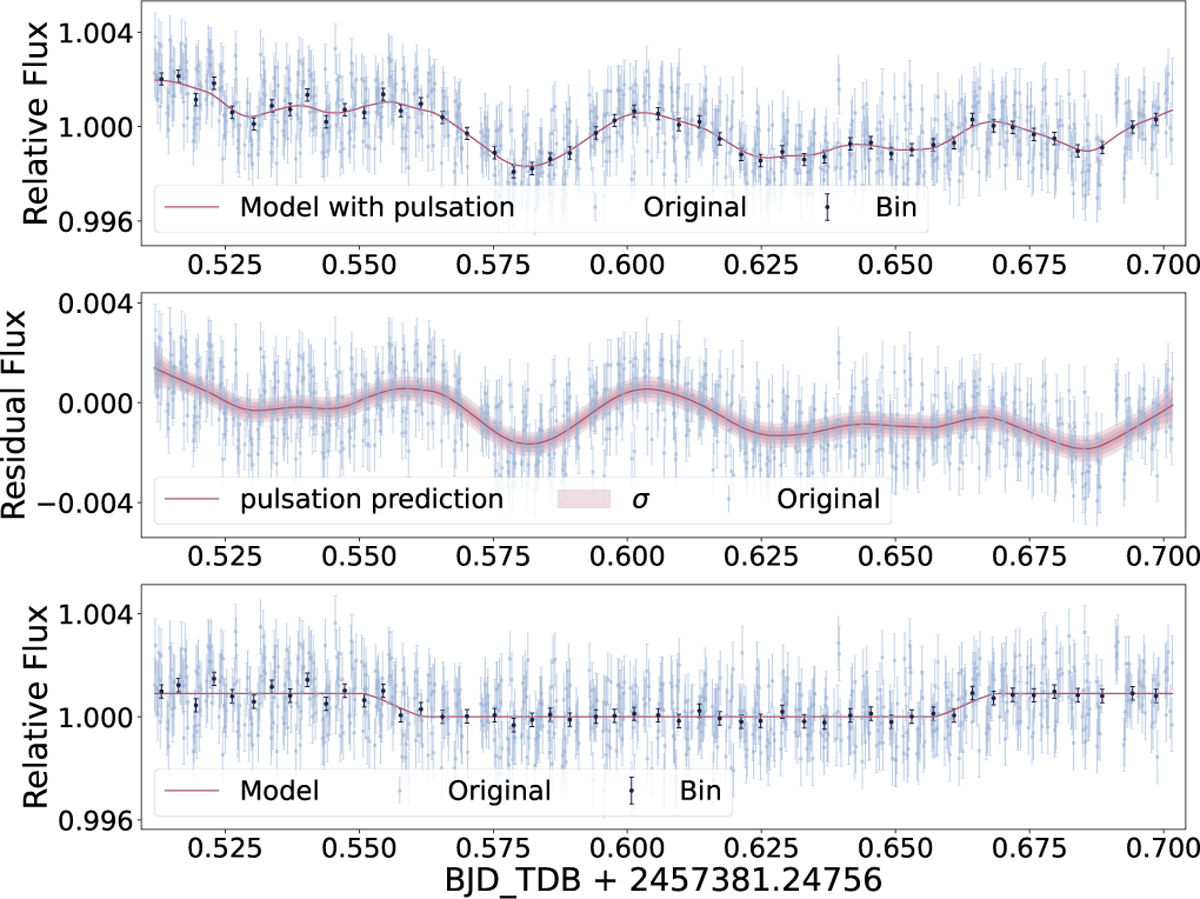
Pulsation noise removal plot for CH4on filter’s data. The upper panel illustrates photometric measurements contaminated by pul-sational noise, depicted as light points (unbinned) and dark points (binned). A synthesized baseline model (red curve) combines the eclipse signal generated with batman and the pulsational signature predicted by celerite2. The middle and lower panels respectively present the extracted pulsational component and the corrected eclipse light curve after systematic noise removal.
Current usage metrics show cumulative count of Article Views (full-text article views including HTML views, PDF and ePub downloads, according to the available data) and Abstracts Views on Vision4Press platform.
Data correspond to usage on the plateform after 2015. The current usage metrics is available 48-96 hours after online publication and is updated daily on week days.
Initial download of the metrics may take a while.