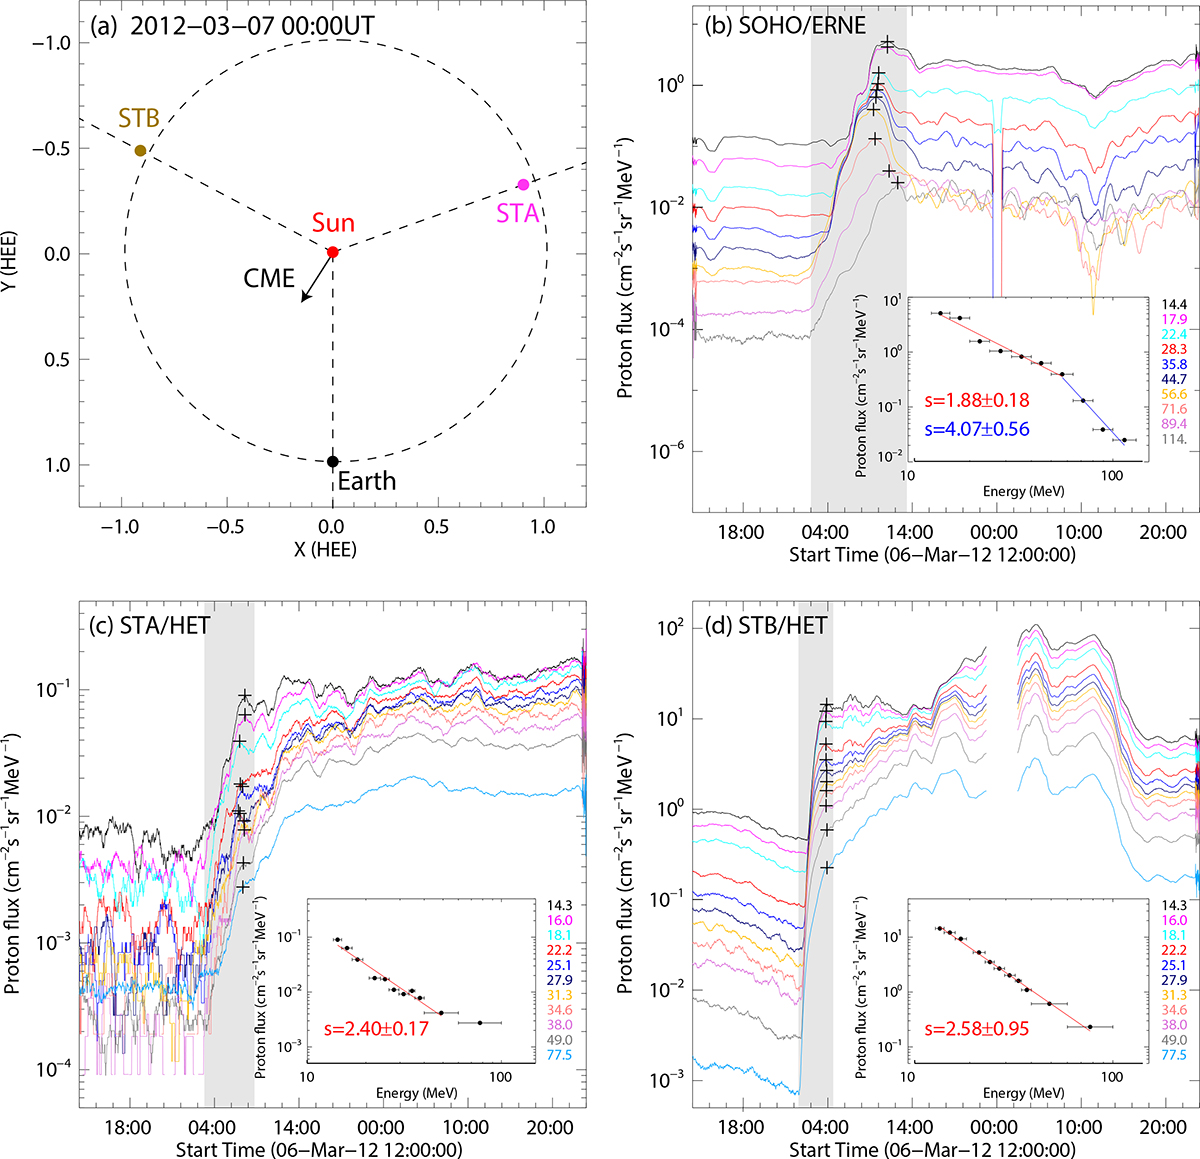
Fig. 3.
Download original image
(a) Positions of STA, STB, and Earth at 00:00 UT on 2012 March 7. The black arrow represents the direction of the CME propagation. (b) 1-hour averaged proton intensities measured by SOHO/ERNE. (c) 1-hour averaged proton intensities measured by STA/HET. (d) 1-hour averaged proton intensities measured by STB/HET. The black plus signs represent the peak flux of each energy range. The inset panels display the power-law fitting of peak flux, and the fit spectral indices are indicated. The shaded region is the time interval used for the fluence spectrum.
Current usage metrics show cumulative count of Article Views (full-text article views including HTML views, PDF and ePub downloads, according to the available data) and Abstracts Views on Vision4Press platform.
Data correspond to usage on the plateform after 2015. The current usage metrics is available 48-96 hours after online publication and is updated daily on week days.
Initial download of the metrics may take a while.