Fig. 4
Download original image
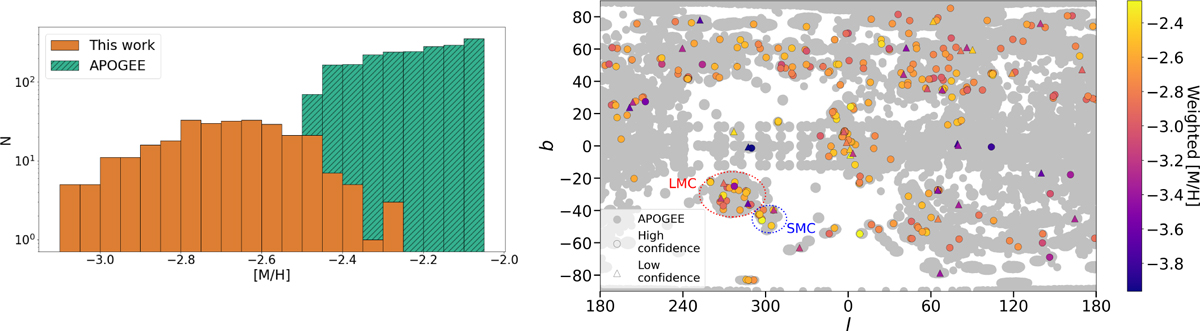
The left panel is a histogram of the number of stars per bin (on a log scale) with stacked bars of the original truncated metal-poor tail of APOGEE with weighted metallicities from the high-confidence sample. The reported metallicities already include the quality cuts. On the right, the same clean sample with weighted metallicities is mapped onto the celestial sphere and superimposed on the APOGEE footprint. The location of the LMC and SMC, where there is a concentration of stars, has been marked.
Current usage metrics show cumulative count of Article Views (full-text article views including HTML views, PDF and ePub downloads, according to the available data) and Abstracts Views on Vision4Press platform.
Data correspond to usage on the plateform after 2015. The current usage metrics is available 48-96 hours after online publication and is updated daily on week days.
Initial download of the metrics may take a while.