Open Access
Fig. 6
Download original image
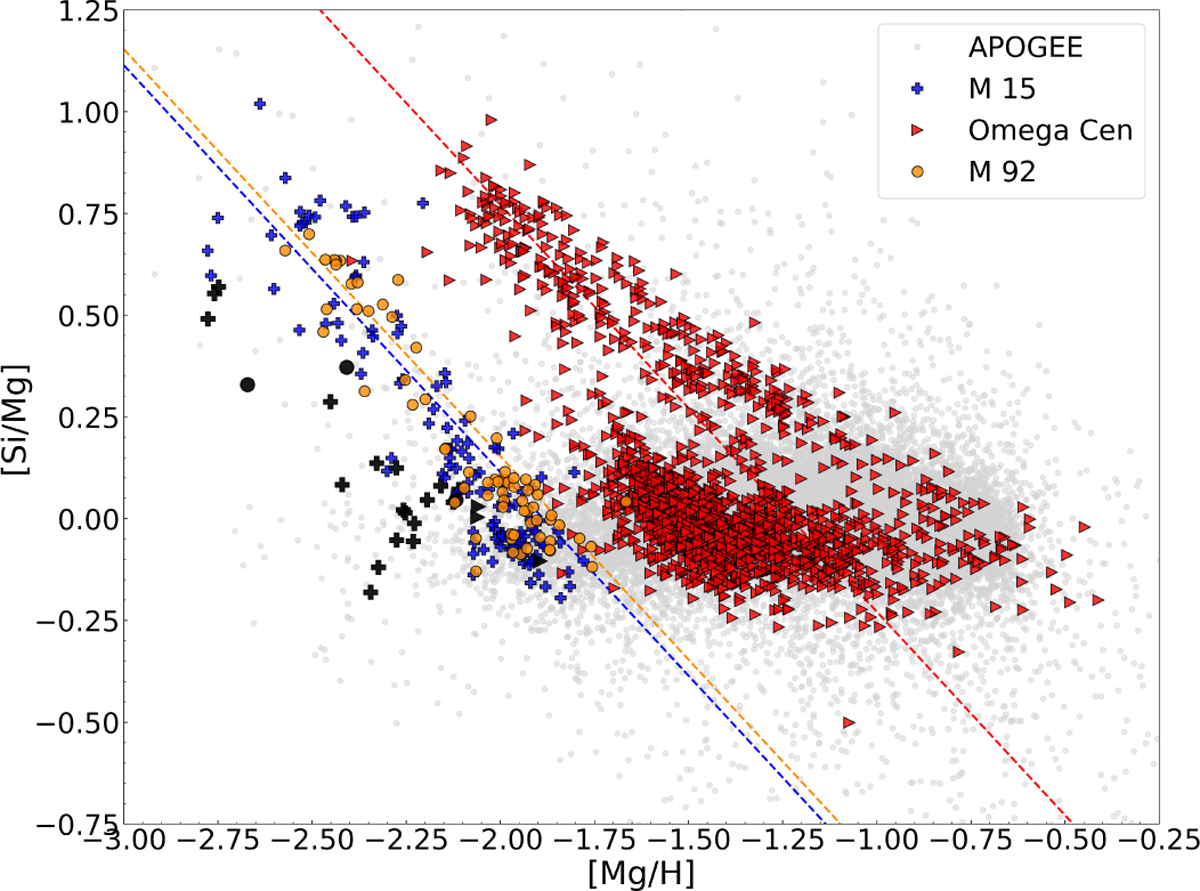
[Si/Mg] vs. [Mg/H] for the GC stars in our sample (shown in black), along with APOGEE abundances for the same GCs (shown with the same symbols as our measurements). The dotted lines indicate y=x lines for each cluster that match the cluster stars at high [Si/Mg] values.
Current usage metrics show cumulative count of Article Views (full-text article views including HTML views, PDF and ePub downloads, according to the available data) and Abstracts Views on Vision4Press platform.
Data correspond to usage on the plateform after 2015. The current usage metrics is available 48-96 hours after online publication and is updated daily on week days.
Initial download of the metrics may take a while.