Fig. 8
Download original image
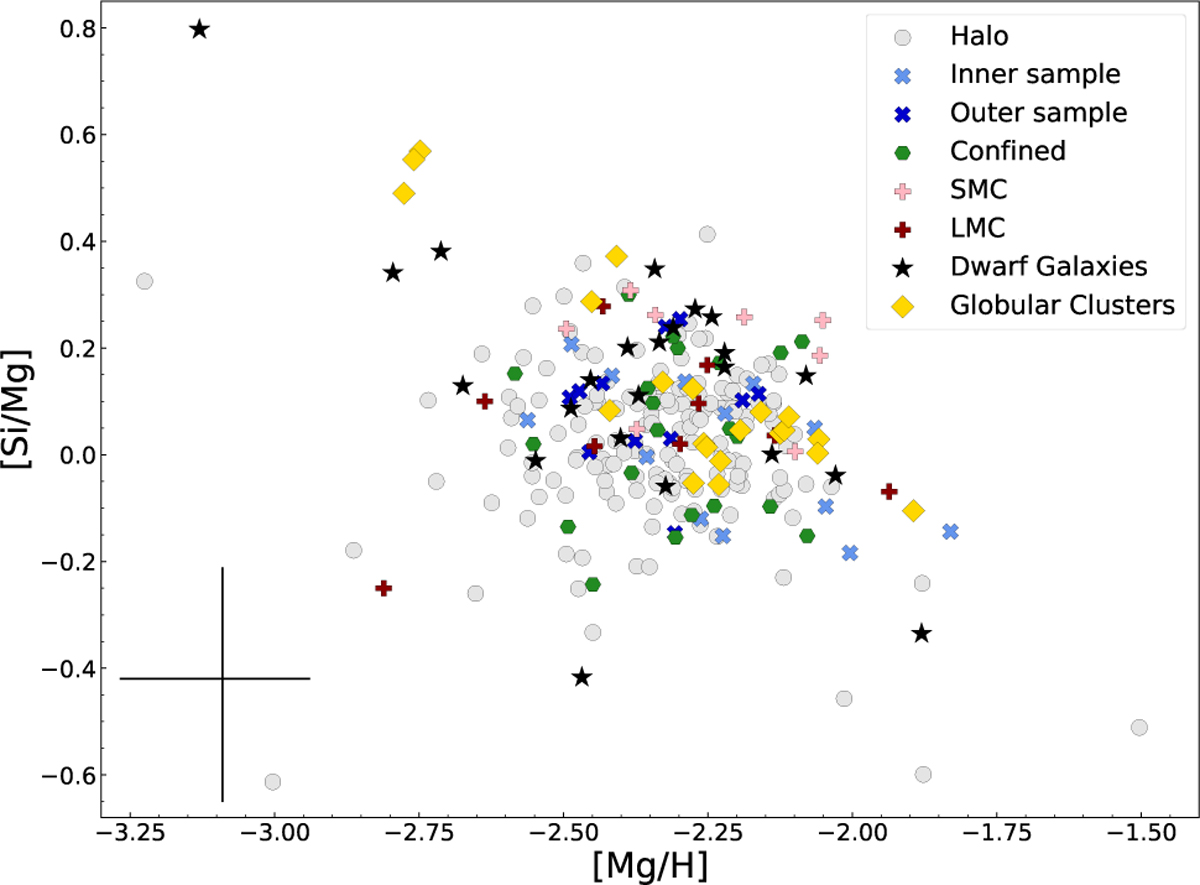
Abundances for the high-confidence sample, plotted as [Mg/H] against [Si/Mg]. The sample is split according to the kinematic selection made in Paper I, and also into different dwarf galaxies according to Battaglia et al. (2022) and for the Magellanic Clouds, the selection made in Paper I. The median errors for the abundances are shown in the bottom left corner.
Current usage metrics show cumulative count of Article Views (full-text article views including HTML views, PDF and ePub downloads, according to the available data) and Abstracts Views on Vision4Press platform.
Data correspond to usage on the plateform after 2015. The current usage metrics is available 48-96 hours after online publication and is updated daily on week days.
Initial download of the metrics may take a while.