Fig. A.1
Download original image
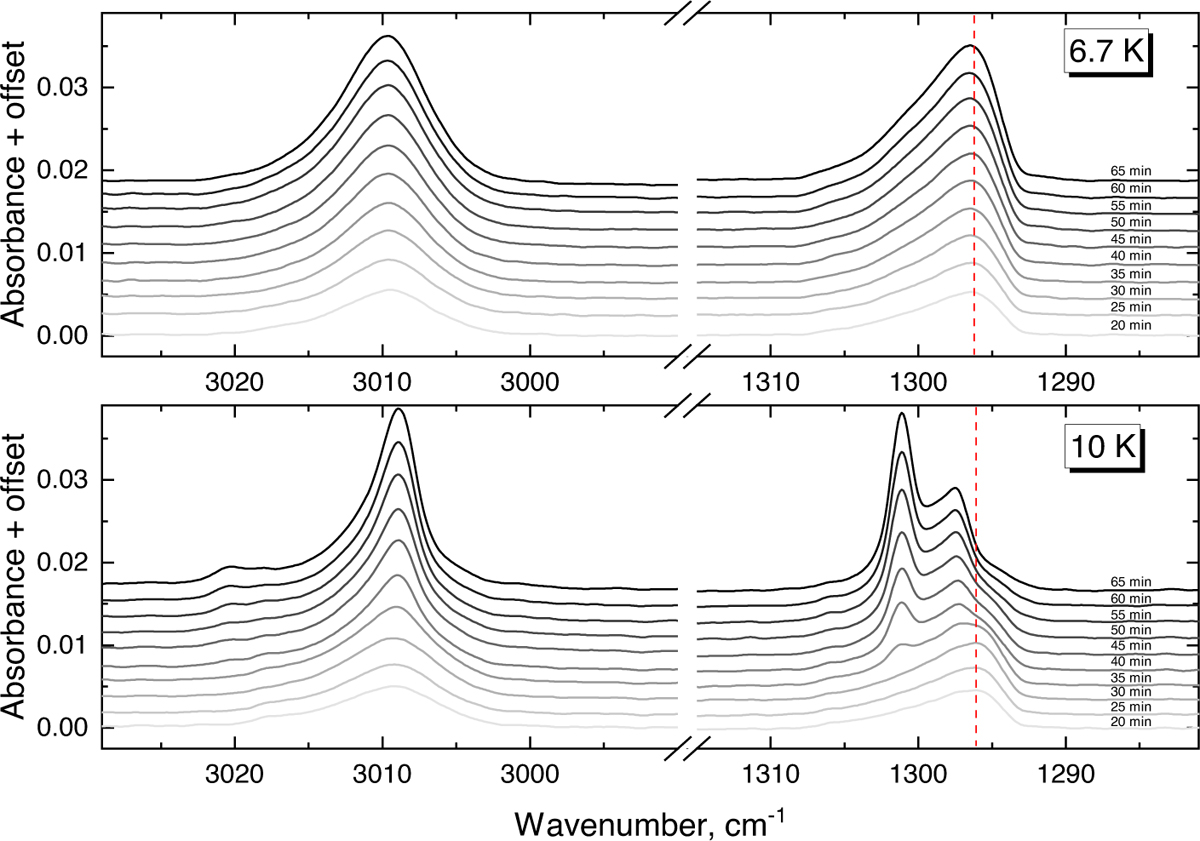
Top panel: Selected IR spectra of pure methane deposition from 20th to 65th minutes with 6.7 K temperature (column density (0.7 to 2.3)×1016 cm−2). Bottom panel: IR spectra of pure methane deposition from 20th to 65th minutes with 10 K temperature (column density (0.7–2.3)×1016 cm−2). The dashed red line shows the peak position of methane in phase II*.
Current usage metrics show cumulative count of Article Views (full-text article views including HTML views, PDF and ePub downloads, according to the available data) and Abstracts Views on Vision4Press platform.
Data correspond to usage on the plateform after 2015. The current usage metrics is available 48-96 hours after online publication and is updated daily on week days.
Initial download of the metrics may take a while.