Fig. 1
Download original image
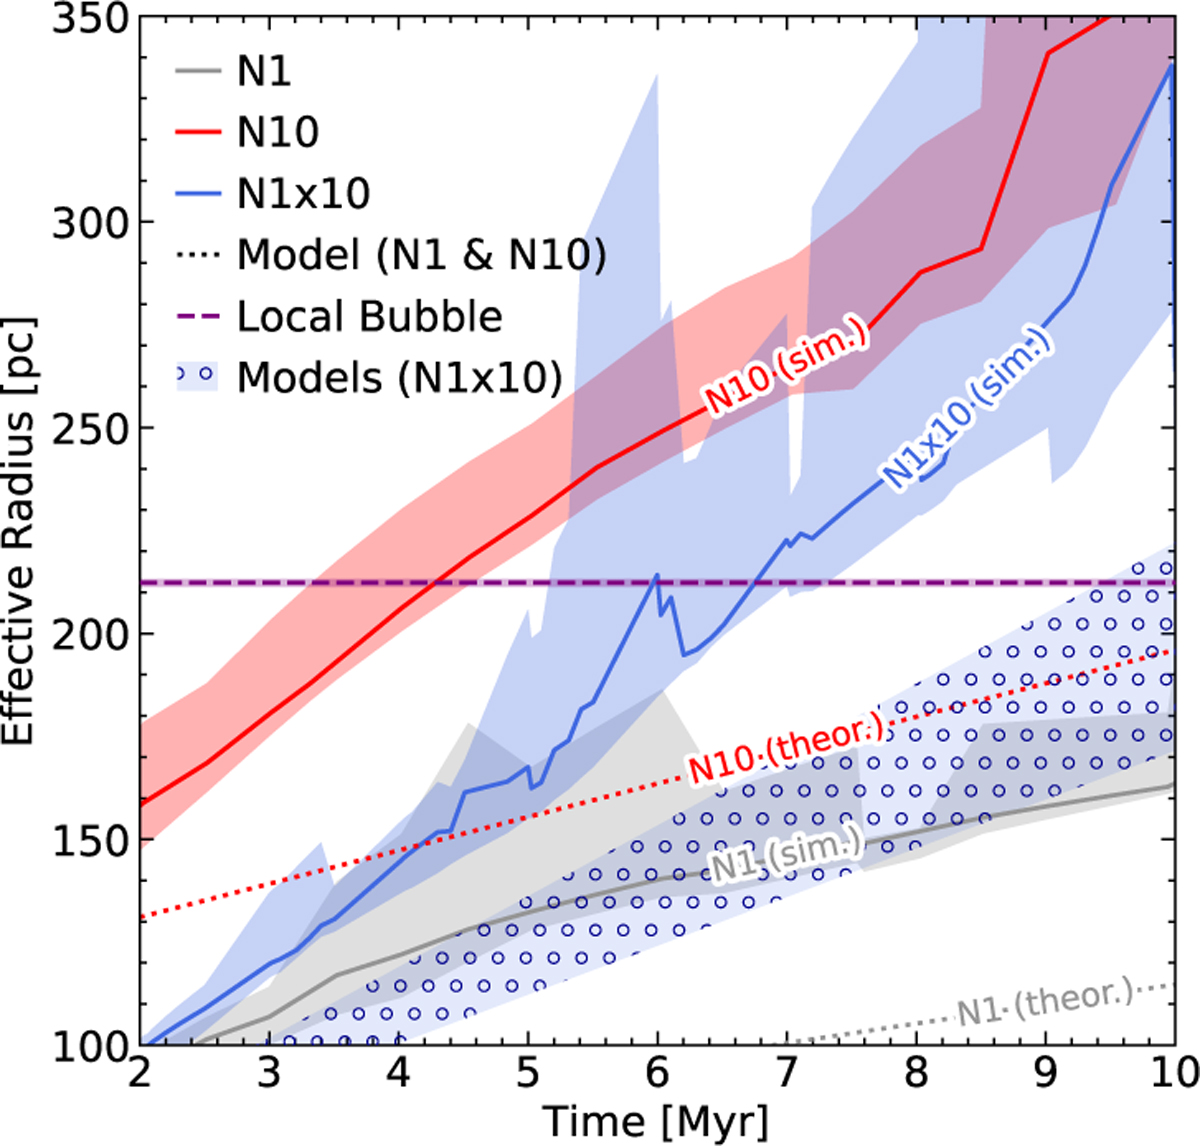
Time evolution of effective size of the simulated sample of SNRs of the SISSI sample between 2 and 10 Myr, for SNRs with ambient densities within 0.3 dex of the LB (Table B.1). Gray, red and blue lines correspond to different explosion models. Solid lines correspond to the median size of the simulated bubbles, with shaded areas corresponding to the range between the 30th and 70th percentiles. Dotted lines and the hatched blue contour correspond to theoretical models based on radiative blastwaves in uniform media (Appendix D). For model N10, the size of the LB corresponds to an age of ∼ 4.5 Myr, while for N1x10 it corresponds to ∼ 6−7 Myr.
Current usage metrics show cumulative count of Article Views (full-text article views including HTML views, PDF and ePub downloads, according to the available data) and Abstracts Views on Vision4Press platform.
Data correspond to usage on the plateform after 2015. The current usage metrics is available 48-96 hours after online publication and is updated daily on week days.
Initial download of the metrics may take a while.