Fig. B.1
Download original image
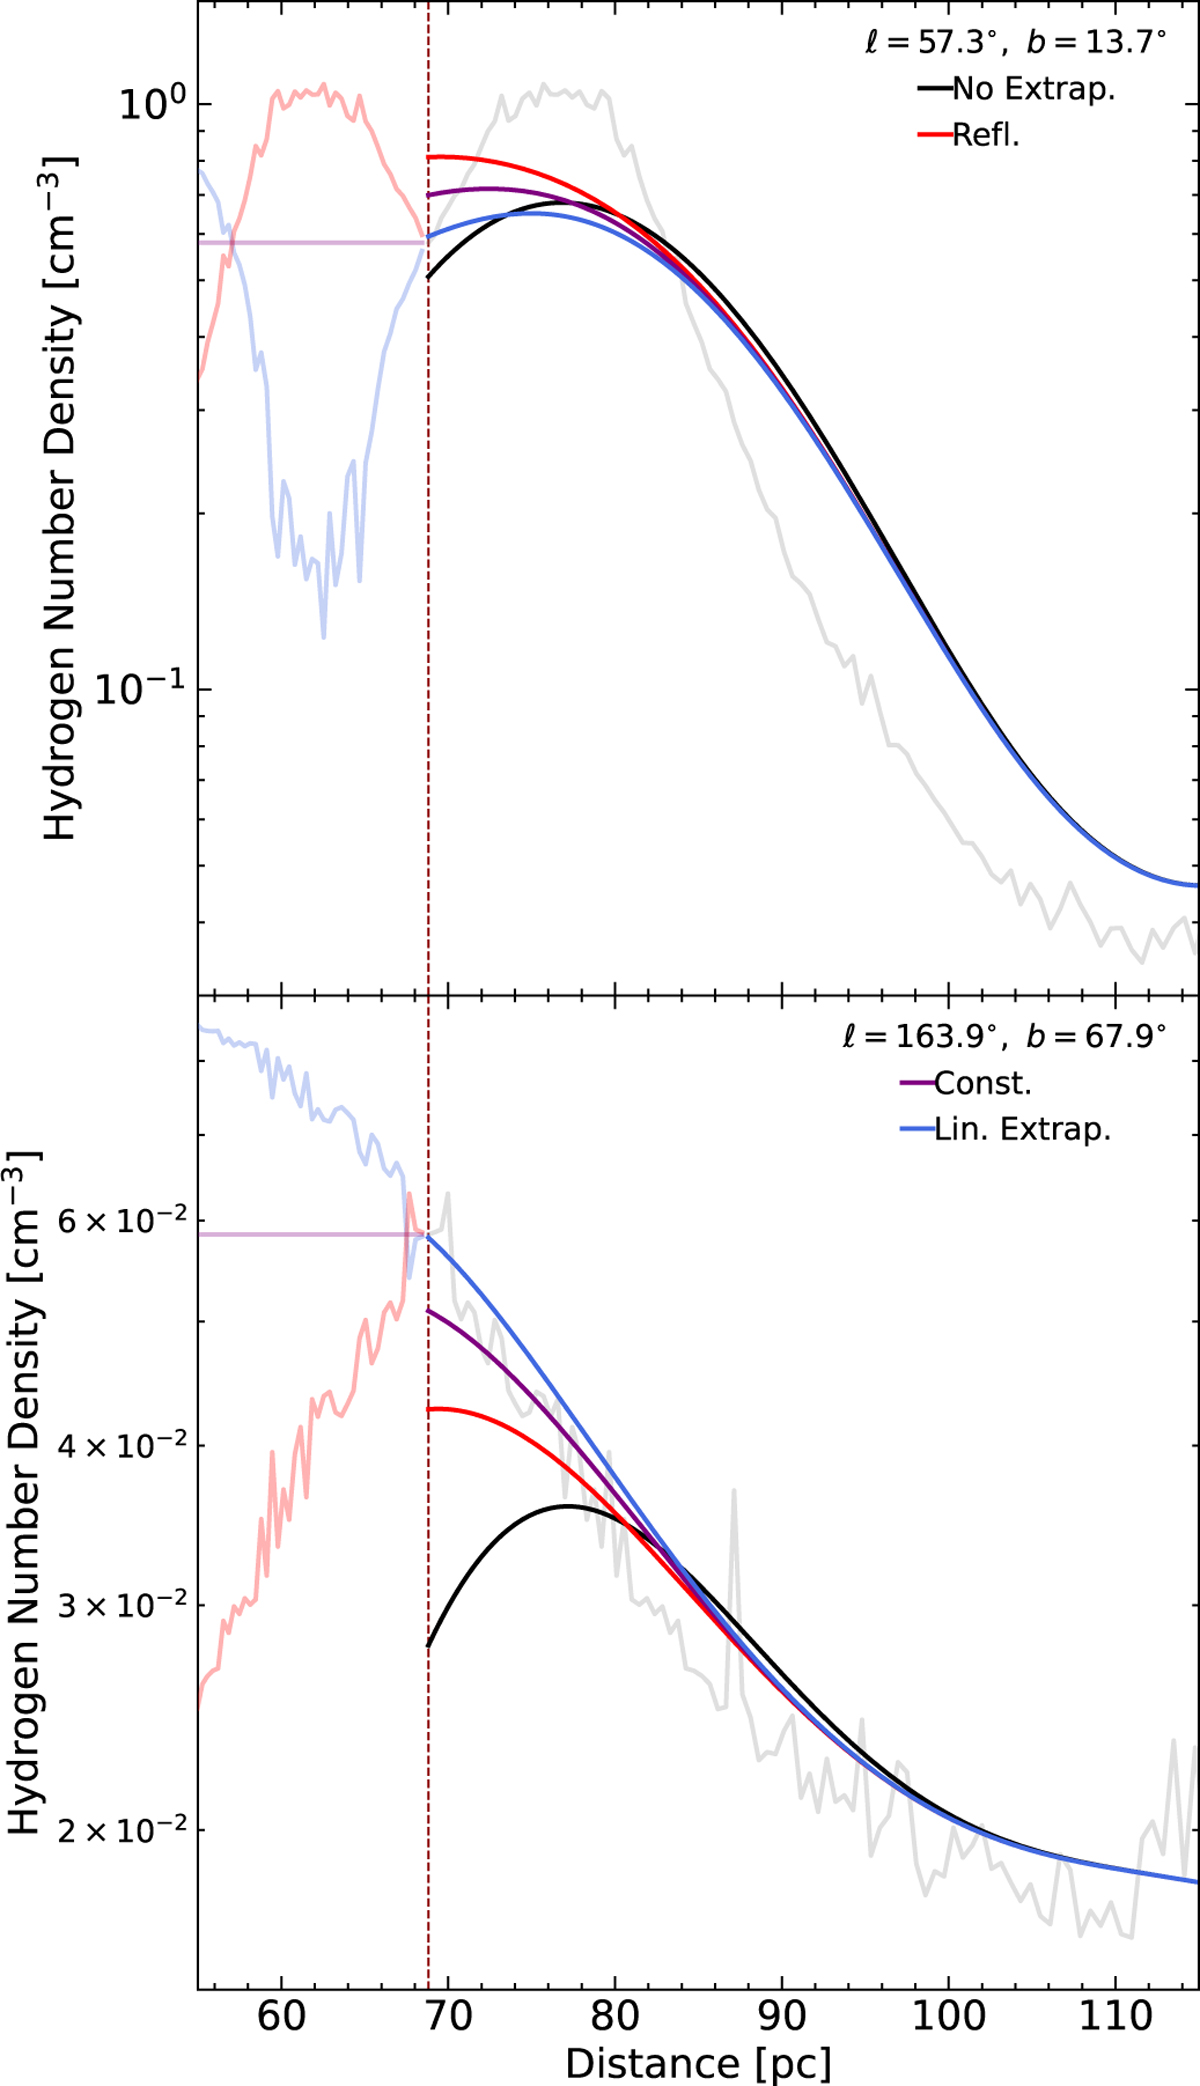
Smoothed density profiles using different boundary treatments for two characteristic lines-of-sight. The boundary is indicated by the dashed vertical line. The original data is shown as a gray line, and the extrapolations beyond the boundary are shown at decreased opacity. The top panel shows a line-of-sight with a peak near the inner boundary, while the bottom panel shows a line of sight with a steep decline near the boundary. With reflective boundary conditions, the peak is missed entirely, while simple normalization adds a spurious peak even in the case of the steep decline.
Current usage metrics show cumulative count of Article Views (full-text article views including HTML views, PDF and ePub downloads, according to the available data) and Abstracts Views on Vision4Press platform.
Data correspond to usage on the plateform after 2015. The current usage metrics is available 48-96 hours after online publication and is updated daily on week days.
Initial download of the metrics may take a while.