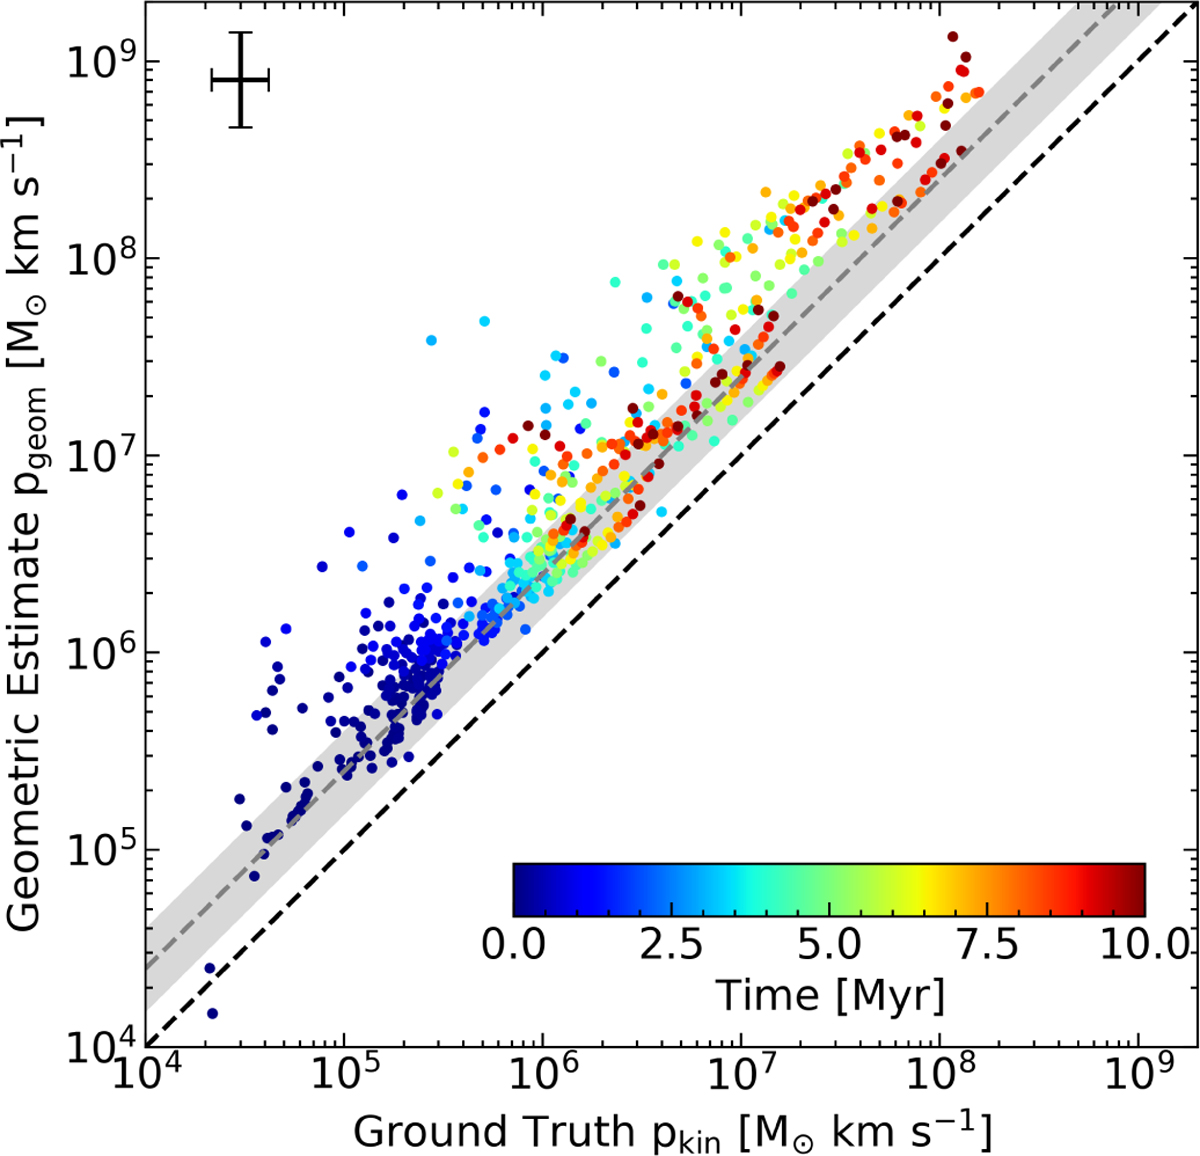
Fig. C.1
Download original image
Comparison of the geometric momentum estimate Eq. B.1 to the true momentum for the simulated sample of SBs from the SISSI simulation at different points in time, as indicated by the color scheme. A representative error bar corresponding to uncertainties due to different ways of defining the center (geometric center vs. center of mass) of the SBs and their volume (threshold value for passive-scalar tracer-variable) is shown in the upper-left corner. The geometrical momentum estimate is slightly biased towards larger values, by a factor of ∼ 2.
Current usage metrics show cumulative count of Article Views (full-text article views including HTML views, PDF and ePub downloads, according to the available data) and Abstracts Views on Vision4Press platform.
Data correspond to usage on the plateform after 2015. The current usage metrics is available 48-96 hours after online publication and is updated daily on week days.
Initial download of the metrics may take a while.