Fig. C.2
Download original image
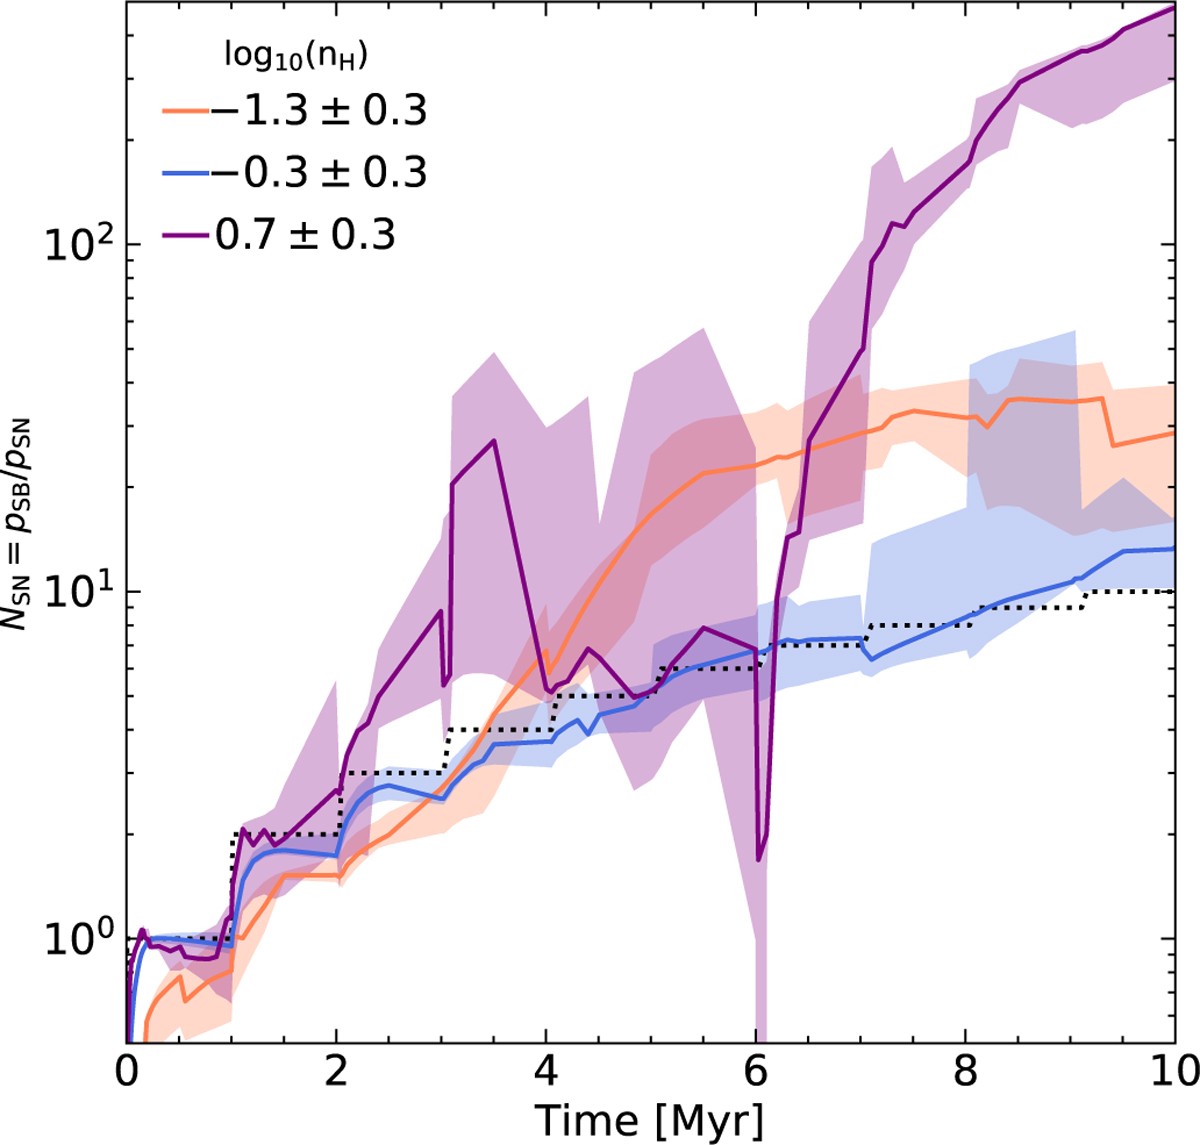
Time-evolution of the SN count estimate Eq. 2 for the simulated sample of SBs in different density ranges. The true SN count is shown as a black dashed line. At extremely high and low ambient densities the estimate appears to overestimate the number of SNe, while for moderate densities, around the density of the LB, the estimate is quite accurate, within about ≲ 50%.
Current usage metrics show cumulative count of Article Views (full-text article views including HTML views, PDF and ePub downloads, according to the available data) and Abstracts Views on Vision4Press platform.
Data correspond to usage on the plateform after 2015. The current usage metrics is available 48-96 hours after online publication and is updated daily on week days.
Initial download of the metrics may take a while.