Fig. F.1
Download original image
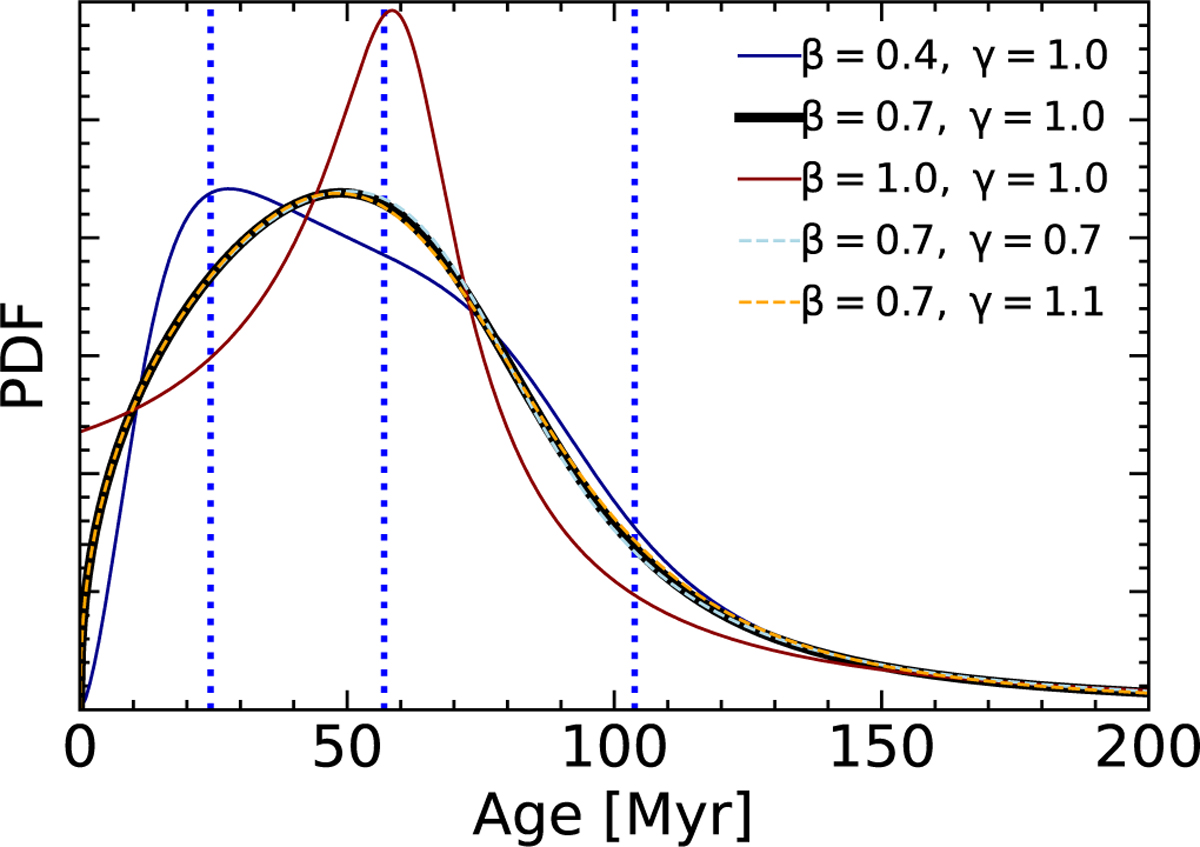
Reconstructed posterior age-pdf for the cluster ADS_16795 for various values of β and γ. Dotted, blue lines correspond to the 16%, 50% and 84% quantiles. For smaller values of β the mode of the distribution is closest to the 16% quantile, while for β ∼ 1 it is closer to the median. For β ≥ 1 the pdf approaches a constant non-zero value for x → 0. While the choice of γ has little influence on the shape of the pdf, for γ ≳ 1.1 the pdf is not longer positive-definite. The pdf corresponding to our fiducial choice of parameters is depicted as a solid, black line.
Current usage metrics show cumulative count of Article Views (full-text article views including HTML views, PDF and ePub downloads, according to the available data) and Abstracts Views on Vision4Press platform.
Data correspond to usage on the plateform after 2015. The current usage metrics is available 48-96 hours after online publication and is updated daily on week days.
Initial download of the metrics may take a while.