Fig. F.3
Download original image
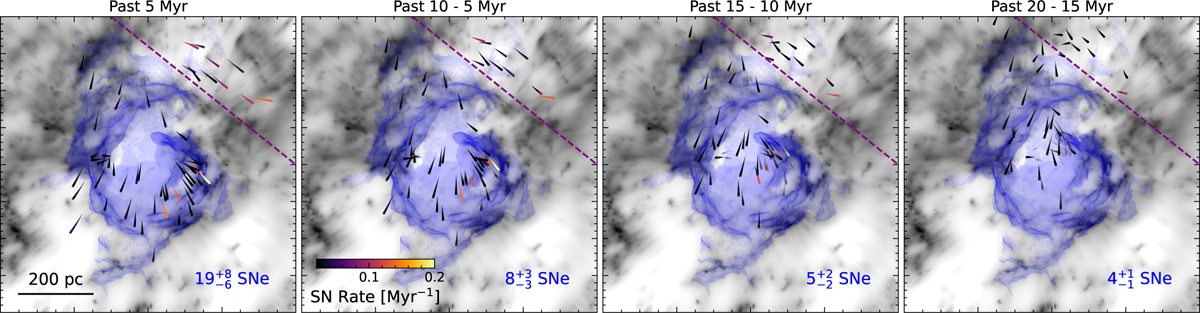
Trajectories of the member clusters of αPer in the local standard of rest, within the vicinity of the LB, from left to right, over the past 5, 5–10, 10–15 and 15–20 Myr. Trajectories are plotted as lines of increasing width, where increasingly wider lines correspond to later times. Trajectories are colored based on the clusters’ instantaneous SN Rate and the opacity is set to the instantaneous probability that the cluster is between tdelay and tactive after its formation and is therefore potentially contributing SNe at a given time. While it is unlikely that a particular cluster colored black has contributed a SN, due to the large stochasticity in low mass clusters, the numerous black clusters might still collectively contribute a significant number of SNe. The projected gas density as well as a projection of the LB’s shell at the present time are also shown to provide context. We also show the number of SNe contributed within each time frame by the clusters, that are co-spatial with the current extent of the LB, using the purple dashed line to decide whether a cluster belongs to the LB or not. With the exception of about 10 clusters in the top right (a few outside the frame) the majority of the clusters has been co-spatial with the current extent of the LB (in projection) for the past few Myr and therefore could have contributed SNe. The number of SNe contributed by nearby clusters in the past 5 Myr is consistent with our estimate in Tab. 1.
Current usage metrics show cumulative count of Article Views (full-text article views including HTML views, PDF and ePub downloads, according to the available data) and Abstracts Views on Vision4Press platform.
Data correspond to usage on the plateform after 2015. The current usage metrics is available 48-96 hours after online publication and is updated daily on week days.
Initial download of the metrics may take a while.