Fig. 1.
Download original image
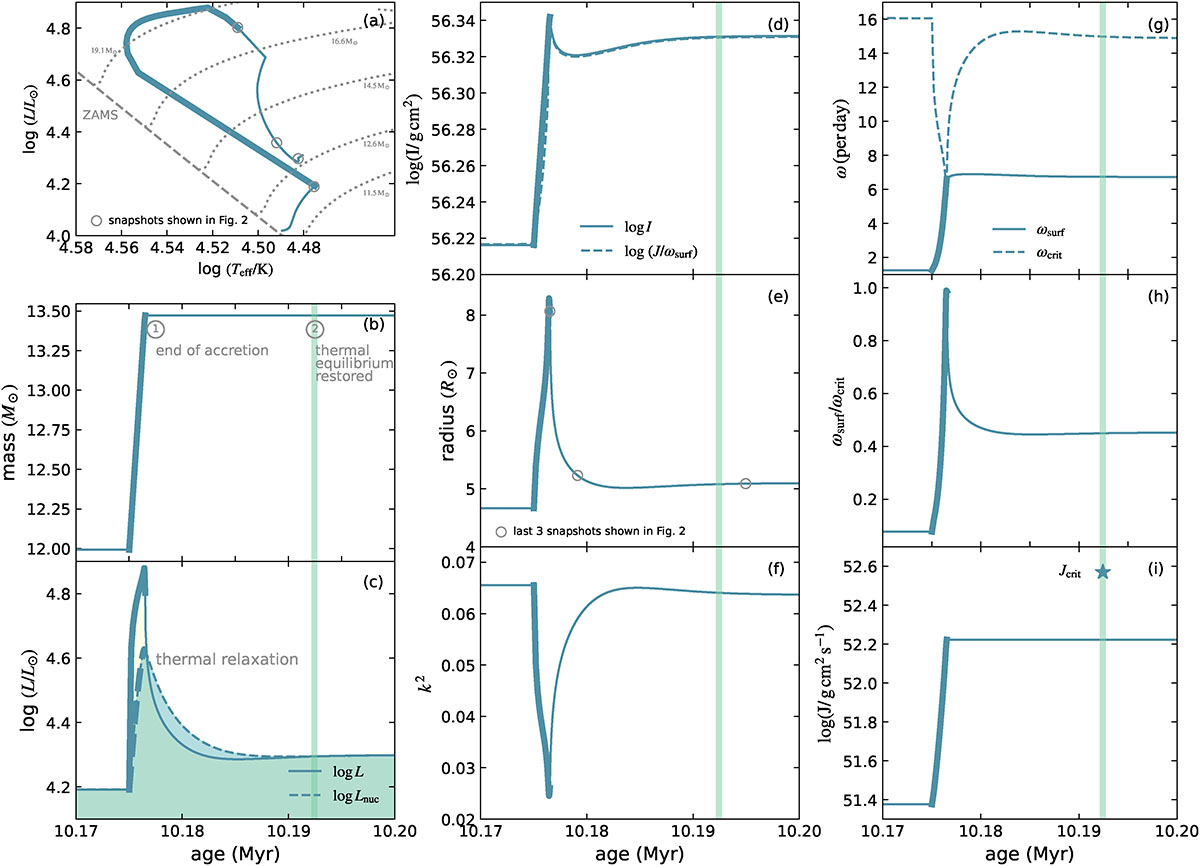
Evolution of a 12 M⊙ stellar model from Set I with an accretion rate of 1.0 × 10⁻³ M⊙ yr−1. Accretion begins when the stellar central hydrogen mass fraction drops to 0.5 and ends when the star reaches critical rotation. Panel a shows the model’s evolution in the Hertzsprung–Russell diagram. The dashed gray line marks the positions of nonrotating zero-age main-sequence stars, and dotted gray lines show evolutionary tracks of nonrotating single-star models from Schootemeijer et al. (2019). Open circles denote the four snapshots for which 2D visualizations of the stellar radius and enclosed mass are presented in Fig. 2. Panels b–i display the time evolution of key physical quantities throughout mass accretion and subsequent thermal relaxation. Thick segments correspond to the accretion phase, and the vertical green line marks the time when TE is restored. Here we define the restoration of TE as the time when the difference between the nuclear energy generation rate and the stellar luminosity falls below 0.2%. (b) Stellar mass. Two key evolutionary times – the end of accretion (1) and the restoration of TE (2) – are indicated. (c) Stellar luminosity (solid line) and luminosity from nuclear burning (dashed line). To facilitate a comparison between the two quantities, the regions beneath the curves are shaded in different colors. (d) Moment of inertia, I (solid), and the logarithm of the ratio of the total angular momentum, J, to the surface angular velocity, ω (dashed). (e) Stellar radius. Open circles correspond to the last three snapshots shown in Fig. 2. (f) Gyration constant, k2. (g) Stellar surface angular velocity (solid) and critical angular velocity (dashed). (h) Ratio of surface angular velocity to the critical value. (i) Total angular momentum (solid) and the angular momentum required to maintain critical rotation once TE is restored assuming solid-body rotation (blue asterisk).
Current usage metrics show cumulative count of Article Views (full-text article views including HTML views, PDF and ePub downloads, according to the available data) and Abstracts Views on Vision4Press platform.
Data correspond to usage on the plateform after 2015. The current usage metrics is available 48-96 hours after online publication and is updated daily on week days.
Initial download of the metrics may take a while.