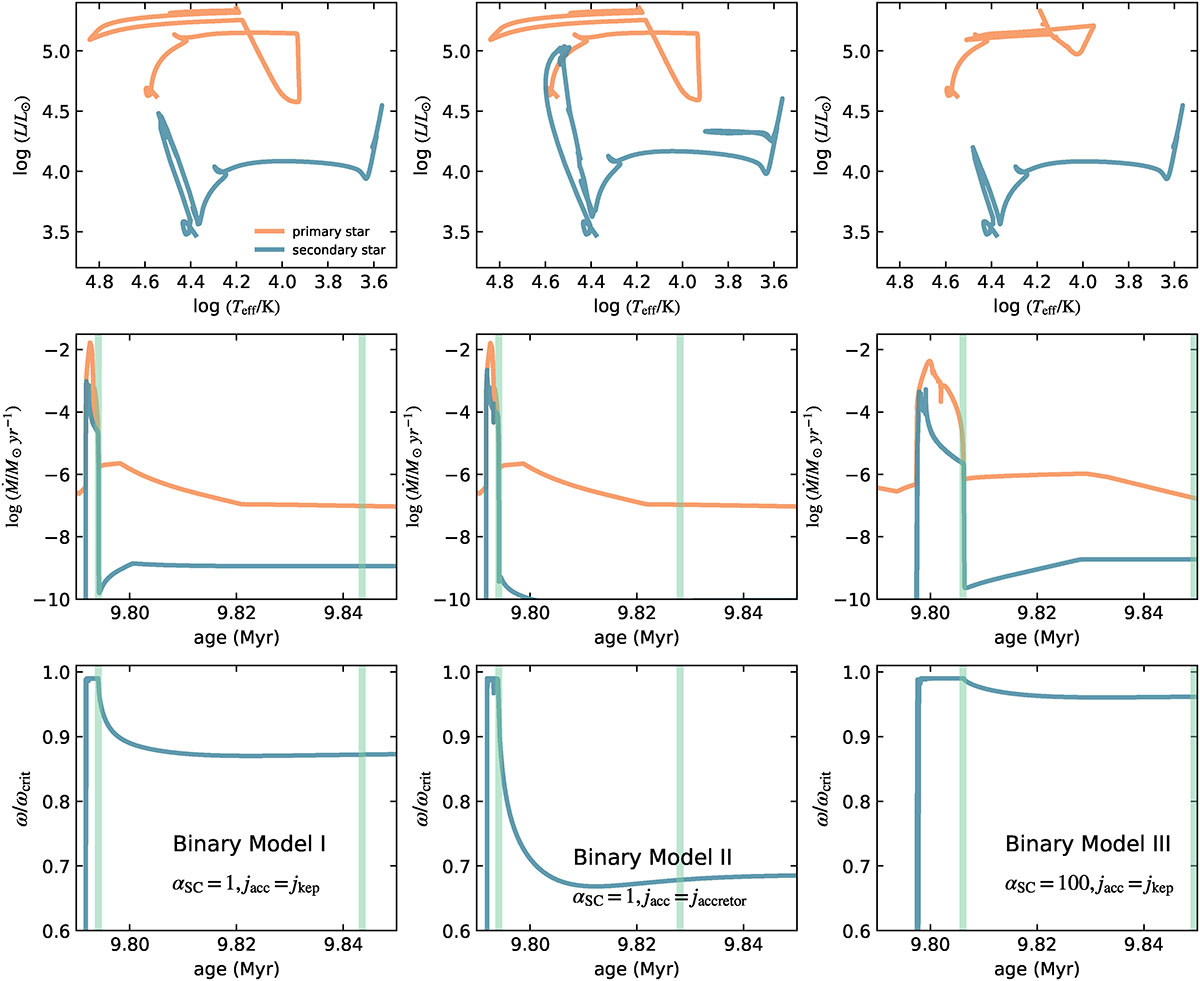
Fig. E.1.
Download original image
Evolution of binary models I (left panels), II (middle panels) and III (right panels), with their initial parameters and physical assumptions listed in Table 1. The top panels show the evolution of the primary (orange) and secondary (blue) stars in the Hertzsprung–Russell diagram. The middle panels display the evolution of the mass loss rate as a function of stellar age, using the same color scheme. The bottom panels show the time evolution of ω/ωcrit for the secondary star. The thick vertical cyan lines indicate, from left to right, the times when mass transfer ceases and when TE is restored.
Current usage metrics show cumulative count of Article Views (full-text article views including HTML views, PDF and ePub downloads, according to the available data) and Abstracts Views on Vision4Press platform.
Data correspond to usage on the plateform after 2015. The current usage metrics is available 48-96 hours after online publication and is updated daily on week days.
Initial download of the metrics may take a while.