Fig. E.2.
Download original image
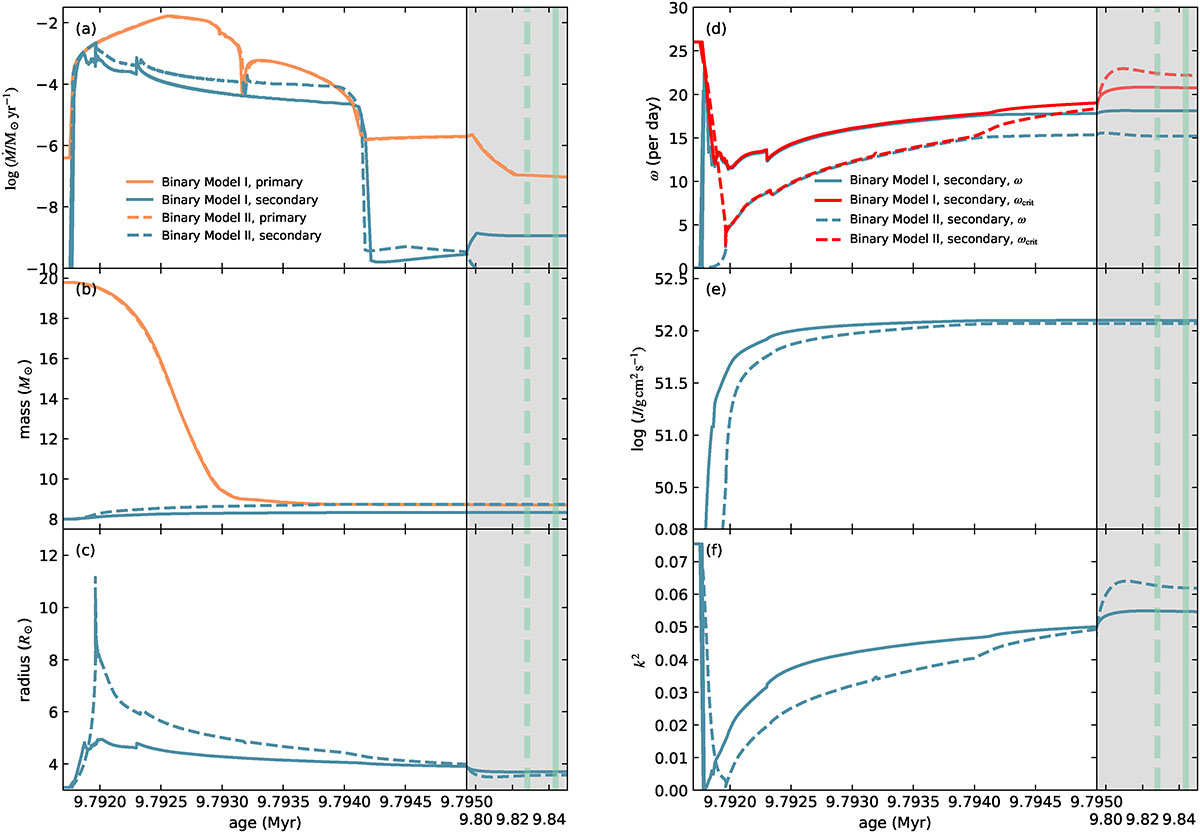
Comparison of the evolution of binary models I and II during (white left region of each panel) and after (gray right region) Case B mass transfer. Each panel is divided such that the narrower right portion represents a longer timescale than the broader left portion. Panels (a) to (f) show the evolution of: (a) mass change rate; (b) stellar mass; (c) stellar radius; (d) stellar surface angular velocity and critical angular velocity; (e) total angular momentum; (f) gyration constant. Orange lines represent the evolution of the primary stars (solid for Model I, dashed for Model II), and blue lines represent the evolution of the secondary stars (with the same linestyles). In Panel (d), red lines denote the critical angular velocities of the secondary stars. In the gray region, the dashed and solid vertical cyan lines indicate the time when the secondary stars in Models II and I, respectively, re-establish TE.
Current usage metrics show cumulative count of Article Views (full-text article views including HTML views, PDF and ePub downloads, according to the available data) and Abstracts Views on Vision4Press platform.
Data correspond to usage on the plateform after 2015. The current usage metrics is available 48-96 hours after online publication and is updated daily on week days.
Initial download of the metrics may take a while.