Fig. E.3.
Download original image
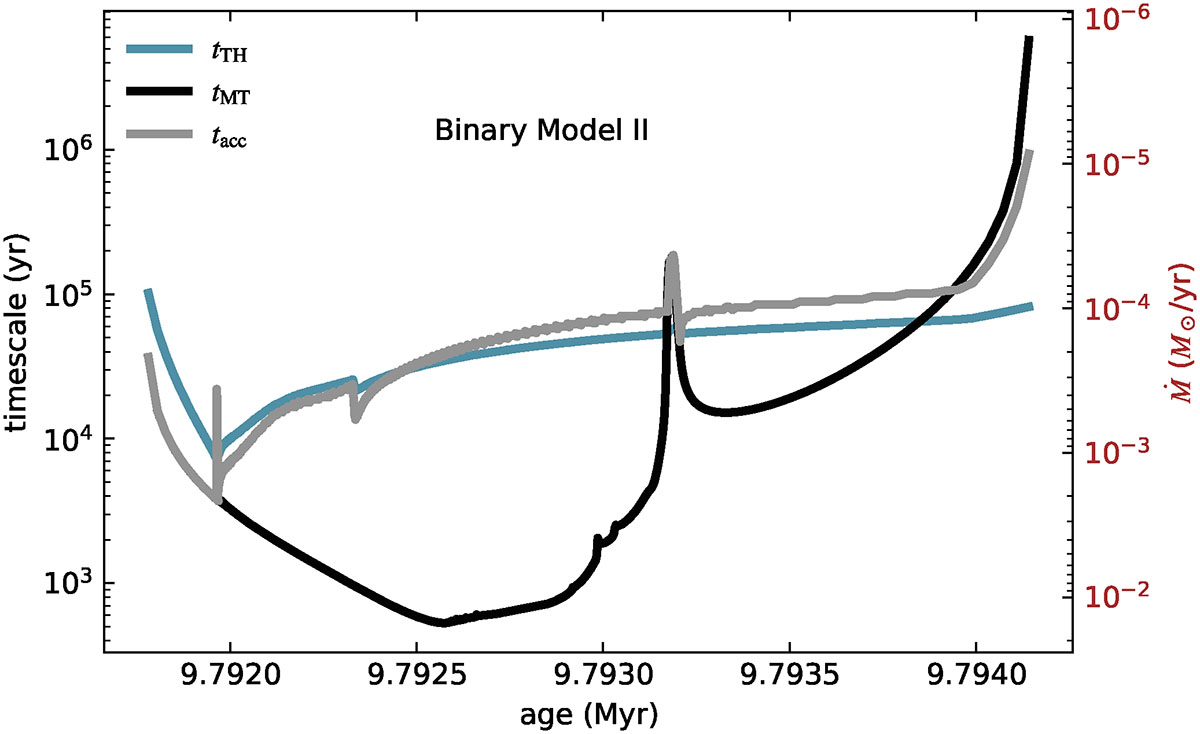
Comparison of characteristic timescales during Case B mass transfer for the accretor in binary model II. The blue line shows the evolution of the accretor’s thermal timescale, while the gray line indicates the accretion timescale based on the actual accretion rate. The black line shows the accretion timescale assuming the accretion rate equals the mass-transfer rate. The right-hand y-axis gives the mass-accretion rate required for an 8 M⊙ star to reach an accretion timescale corresponding to the values on the left-hand axis.
Current usage metrics show cumulative count of Article Views (full-text article views including HTML views, PDF and ePub downloads, according to the available data) and Abstracts Views on Vision4Press platform.
Data correspond to usage on the plateform after 2015. The current usage metrics is available 48-96 hours after online publication and is updated daily on week days.
Initial download of the metrics may take a while.