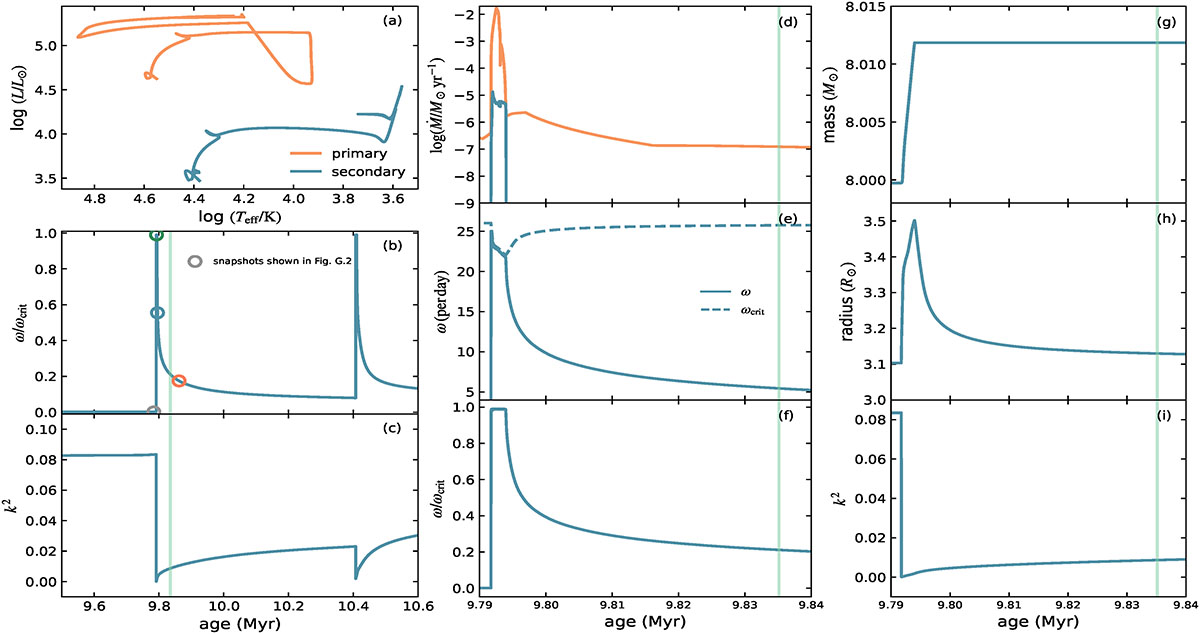
Fig. G.1.
Download original image
Evolution of binary Model V, in which the Tayler–Spruit dynamo is not included, with orange and blue lines showing the primary and secondary stars, respectively. Panel (a) Evolution in the Hertzsprung-Russell diagram. (b,c) Evolution of ω/ωcrit and k2 over the period encompassing Case B and Case BB mass transfer. (d-i) Stellar properties during Case B mass transfer and the subsequent thermal relaxation phase. Vertical cyan lines in Panels (b) to (i) mark the time when TE is re-established. Open circles in panels (b) indicate the four epochs at which the internal spin profiles are shown in Fig. , using the same colors as the corresponding lines in that figure.
Current usage metrics show cumulative count of Article Views (full-text article views including HTML views, PDF and ePub downloads, according to the available data) and Abstracts Views on Vision4Press platform.
Data correspond to usage on the plateform after 2015. The current usage metrics is available 48-96 hours after online publication and is updated daily on week days.
Initial download of the metrics may take a while.