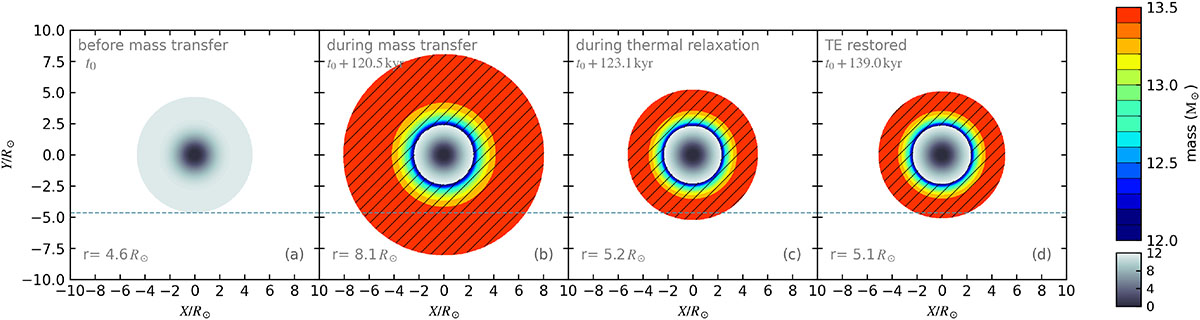
Fig. 2.
Download original image
2D visualization of radius and enclosed mass at four snapshots for a 12 M⊙ star from single-star model Set I, with an initial accretion rate of 1.0 × 10⁻³ M⊙ yr−1. The snapshots span evolution phases before mass transfer (MT), during MT, during thermal relaxation (TR), and after restoring TE. The reference time is t0 = 10.06 Myr. We ignore deviations from spherical symmetry due to critical rotation and use the averaged radius in the X–Y plane. The color scale denotes enclosed mass, with two distinct color maps applied below and above 12 M⊙ to differentiate the original stellar mass from the accreted mass. Hatched regions in panels b–d highlight the accreted layers. The thin horizontal dashed line marks the stellar radius at t0, and the current stellar radius is labeled in each panel.
Current usage metrics show cumulative count of Article Views (full-text article views including HTML views, PDF and ePub downloads, according to the available data) and Abstracts Views on Vision4Press platform.
Data correspond to usage on the plateform after 2015. The current usage metrics is available 48-96 hours after online publication and is updated daily on week days.
Initial download of the metrics may take a while.