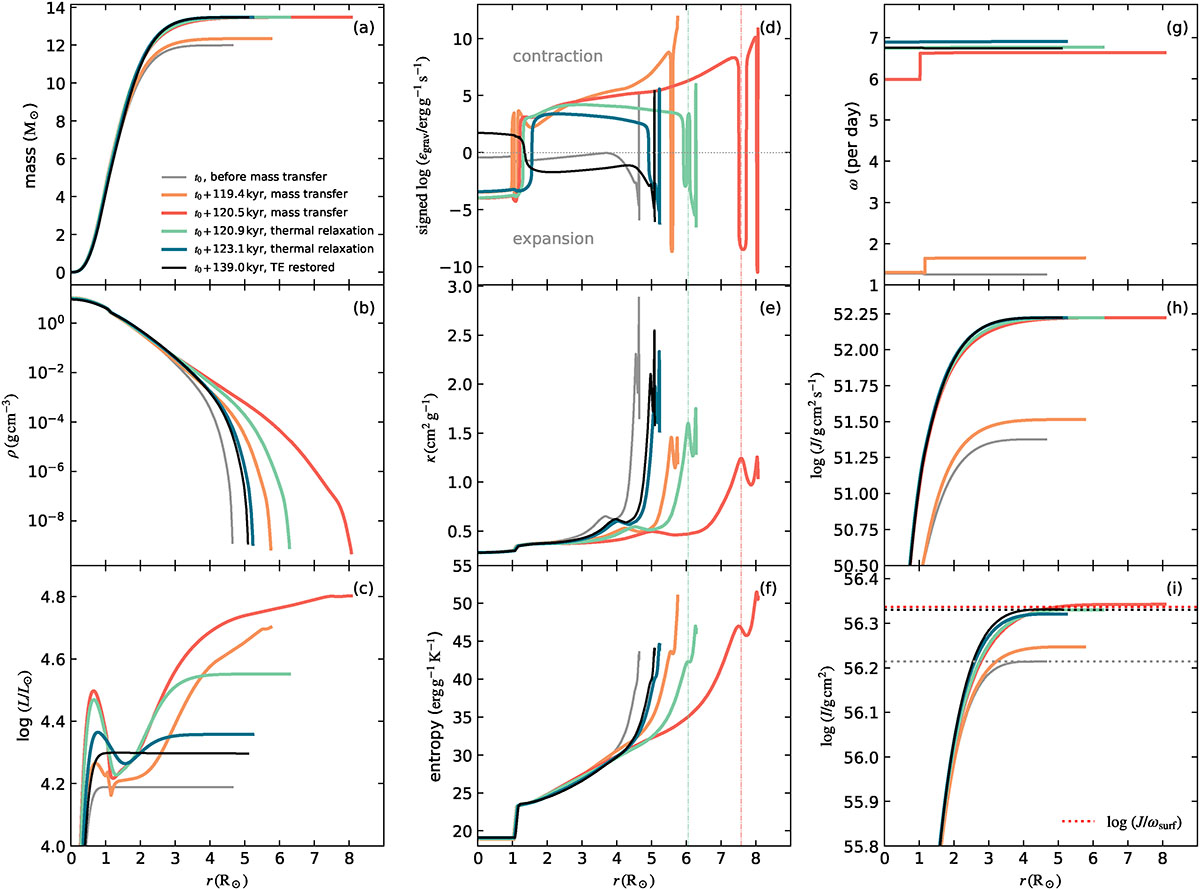
Fig. B.1.
Download original image
Internal profiles of a 12 M⊙ single-star model from Set I accreting at 1.0 × 10⁻³ M⊙ yr−1, shown as a function of radius coordinate. Colored lines correspond to six snapshots covering the phases before mass transfer, during mass transfer, during thermal relaxation, and after restoring TE. The reference time t0 = 10.06 Myr. Panels: (a) enclosed mass; (b) density; (c) luminosity; (d) gravitational energy generation rate (positive=contraction, negative=expansion); (e) opacity; (f) entropy; The thin vertical dashed-dotted lines in Panels (d), (e) and (f) mark the radius of the iron opacity bump. (g) angular velocity; (h) enclosed angular momentum; (i) log I (solid lines) and log(J/ωsurf) (horizontal dotted lines), where J, and ωsurf denoting the total angular momentum, and surface angular velocity at the corresponding snapshots. The relation I = J/ωsurf corresponds to rigid rotation, while I > J/ωsurf indicates differential rotation, with the core rotating more slowly than the envelope.
Current usage metrics show cumulative count of Article Views (full-text article views including HTML views, PDF and ePub downloads, according to the available data) and Abstracts Views on Vision4Press platform.
Data correspond to usage on the plateform after 2015. The current usage metrics is available 48-96 hours after online publication and is updated daily on week days.
Initial download of the metrics may take a while.