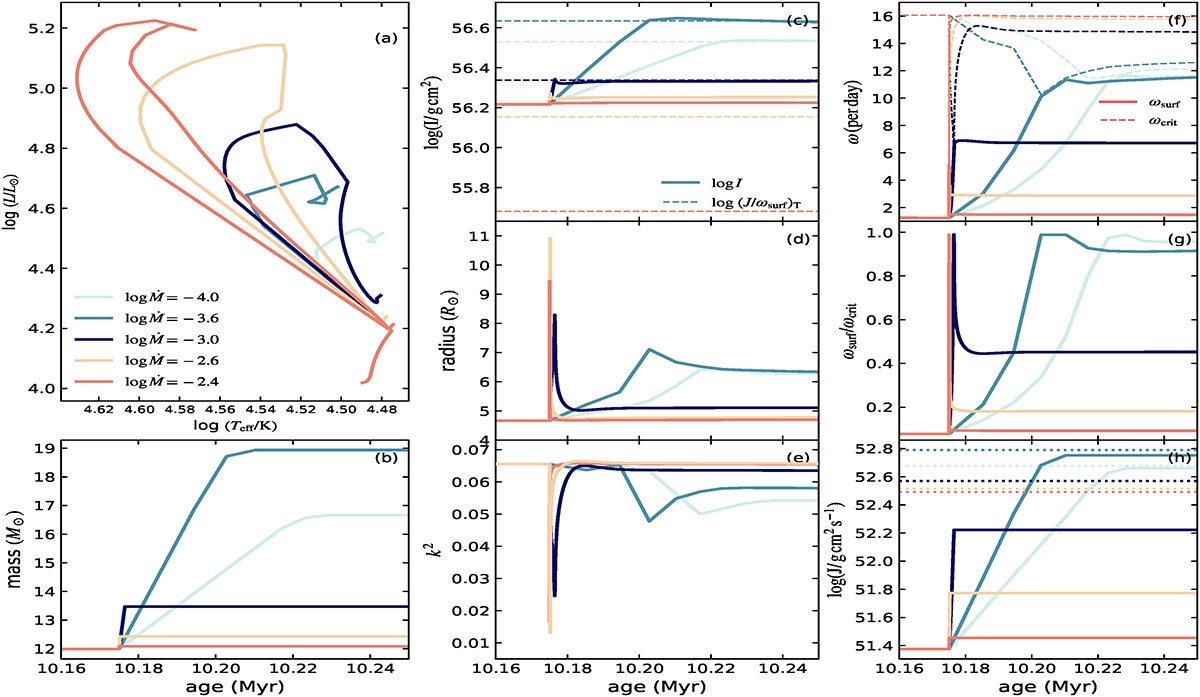
Fig. B.2.
Download original image
Evolution of a 12 M⊙ single-star model accreting material at different constant rates. Each line color corresponds to a specific accretion rate, as indicated in the figure legend. Accretion begins when the central hydrogen abundance drops below 0.5 and terminates once the star reaches critical rotation. Panel (a): Evolutionary tracks in the Hertzsprung–Russell diagram. Panels (b)-(h): Time evolution of key stellar properties. (b) stellar mass; (c) moment of inertia I (solid) and the logarithm of the ratio between the total angular momentum J and the surface angular velocity ω at the termination of mass transfer (dashed); (d) stellar radius; (e) gyration constant k2; (f) surface angular velocity (solid lines) and critical velocity (dashed lines); (g): ratio of surface angular velocity to critical velocity; (h): logarithm of the total angular momentum (solid line) and the total angular momentum required for the corresponding model to rotate at the critical velocities after TE is restored.
Current usage metrics show cumulative count of Article Views (full-text article views including HTML views, PDF and ePub downloads, according to the available data) and Abstracts Views on Vision4Press platform.
Data correspond to usage on the plateform after 2015. The current usage metrics is available 48-96 hours after online publication and is updated daily on week days.
Initial download of the metrics may take a while.