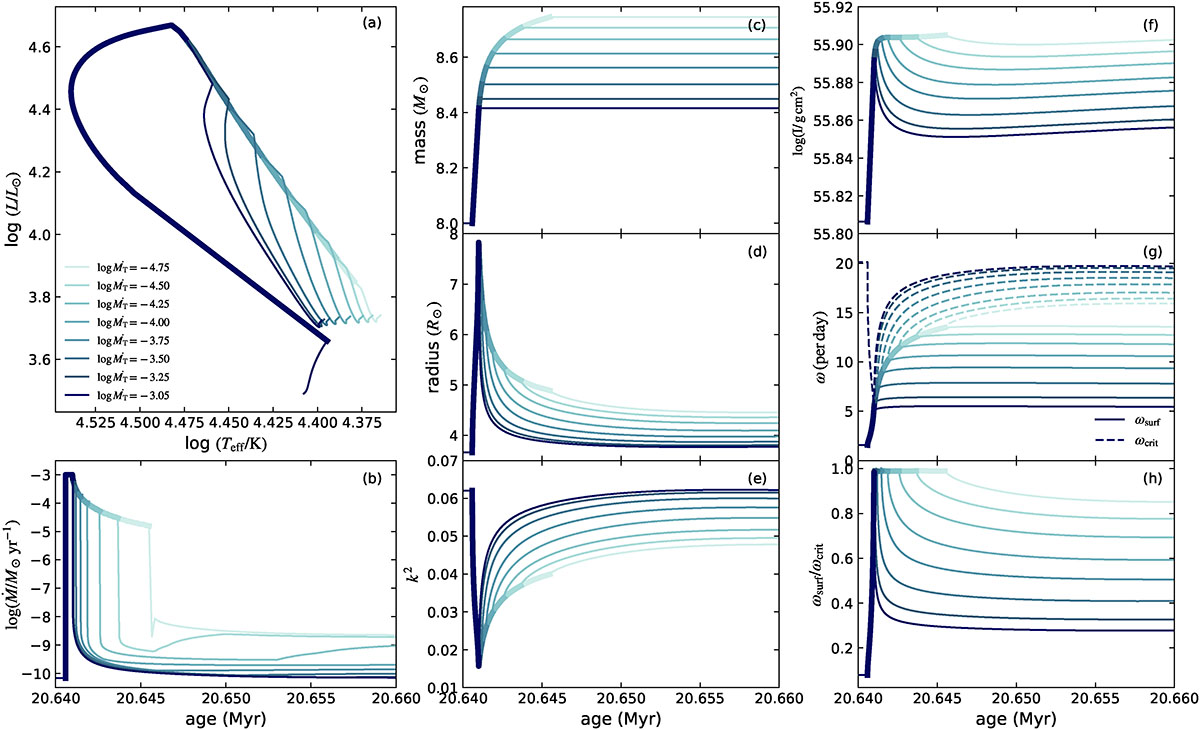
Fig. C.1.
Download original image
Evolution of 8 M⊙ single-star models from Set II with an initial accretion rate of 1.0 × 10⁻³ M⊙/yr. Accretion begins when the central hydrogen mass fraction reaches 0.5. After the star first attains critical rotation, the accretion rate is gradually reduced to keep the surface rotation just below the critical value, and is then terminated at different rates, as indicated by the colored lines corresponding to the values listed in the legend. Panel (a) shows the evolution of the stellar model in the Hertzsprung-Russell diagram. Panels (b) to (h) present the time evolution of key stellar properties. (b) mass accretion rate; (c) stellar mass; (d) stellar radius; (e) gyration constant k2; (f) moment of inertia; (g) surface angular velocity (solid lines) and critical rotation velocity (dashed lines); (h) ratio of rotational to critical angular velocity. In all panels, thick lines highlight the accretion stage.
Current usage metrics show cumulative count of Article Views (full-text article views including HTML views, PDF and ePub downloads, according to the available data) and Abstracts Views on Vision4Press platform.
Data correspond to usage on the plateform after 2015. The current usage metrics is available 48-96 hours after online publication and is updated daily on week days.
Initial download of the metrics may take a while.