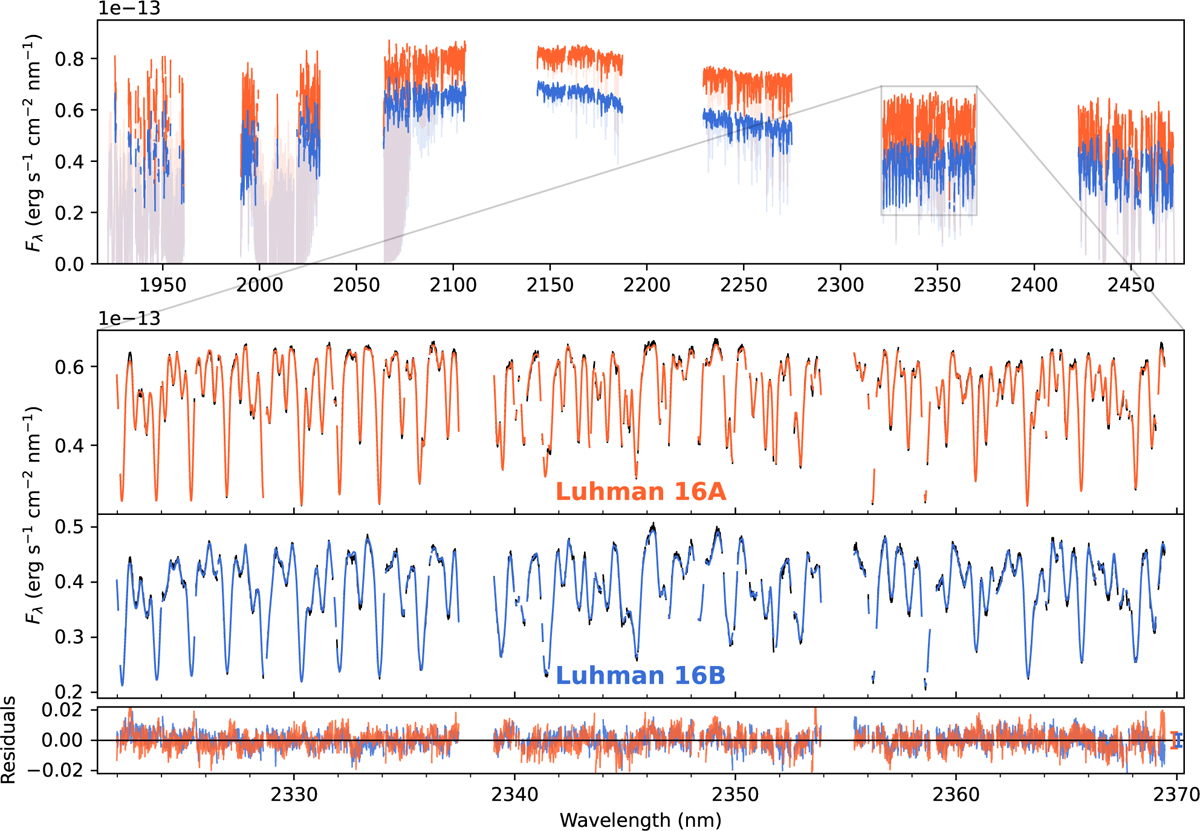
Fig. 1
Download original image
CRIRES+ K-band spectra of Luhman 16A and B in orange and blue, respectively. Top panel : seven spectral orders covered in the K2166 wavelength setting. The telluric absorption is shown as transparent lines. Lower panels : zoom-in of the sixth order. The black observed spectra are overlaid with the best-fitting free-chemistry models in orange and blue. The mean scaled uncertainties are displayed to the right of the residuals in the bottom panel. The fits to the other spectral orders can be found in Appendix D.
Current usage metrics show cumulative count of Article Views (full-text article views including HTML views, PDF and ePub downloads, according to the available data) and Abstracts Views on Vision4Press platform.
Data correspond to usage on the plateform after 2015. The current usage metrics is available 48-96 hours after online publication and is updated daily on week days.
Initial download of the metrics may take a while.