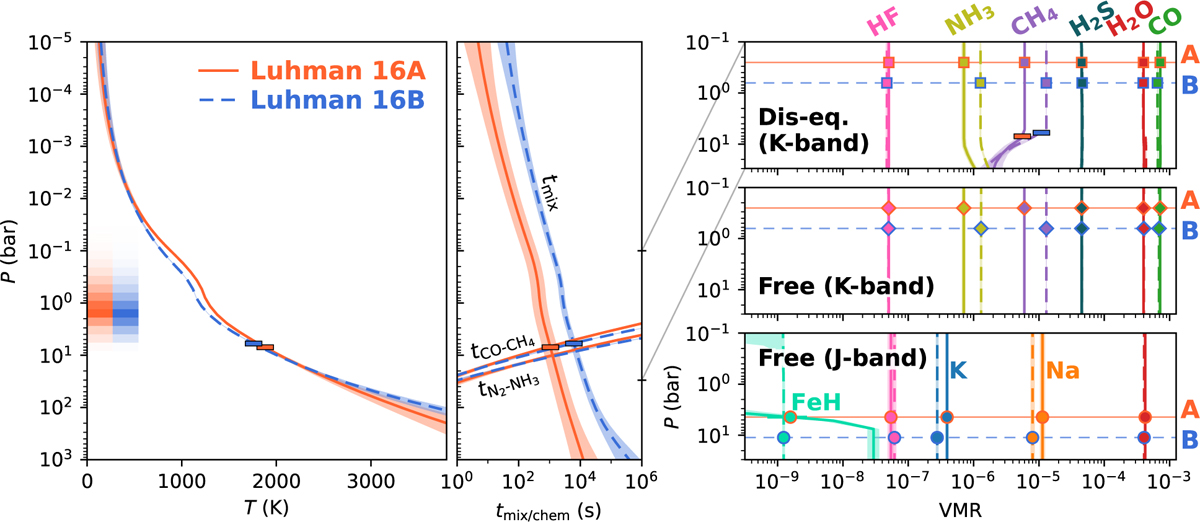
Fig. 6
Download original image
Comparison of temperature and abundance constraints. Left panel : temperature profiles of Luhman 16A and B, retrieved with the chemical disequilibrium model described in Sect. 2.2.3. Luhman 16A displays a heating of ~100 K near the photosphere, which is indicated by the shaded regions in the left side of the panel. Middle panel : mixing and chemical reaction timescales as functions of pressure. The intersection where vertical mixing becomes more efficient than the CO-CH4 reaction is indicated by a horizontal bar. The higher Kzz for Luhman 16A is visible from its reduced mixing timescale. Right panels : cutouts of the chemical abundance profiles between 0.06 and 30 bar. From top to bottom : chemical disequilibrium and free-chemistry abundances from the K-band analysis of this work, and the CRIRES+ J-band constraints presented in de Regt et al. (2025b). The envelopes and error bars in all panels show the 68% credible region.
Current usage metrics show cumulative count of Article Views (full-text article views including HTML views, PDF and ePub downloads, according to the available data) and Abstracts Views on Vision4Press platform.
Data correspond to usage on the plateform after 2015. The current usage metrics is available 48-96 hours after online publication and is updated daily on week days.
Initial download of the metrics may take a while.