Open Access
Fig. 4.
Download original image
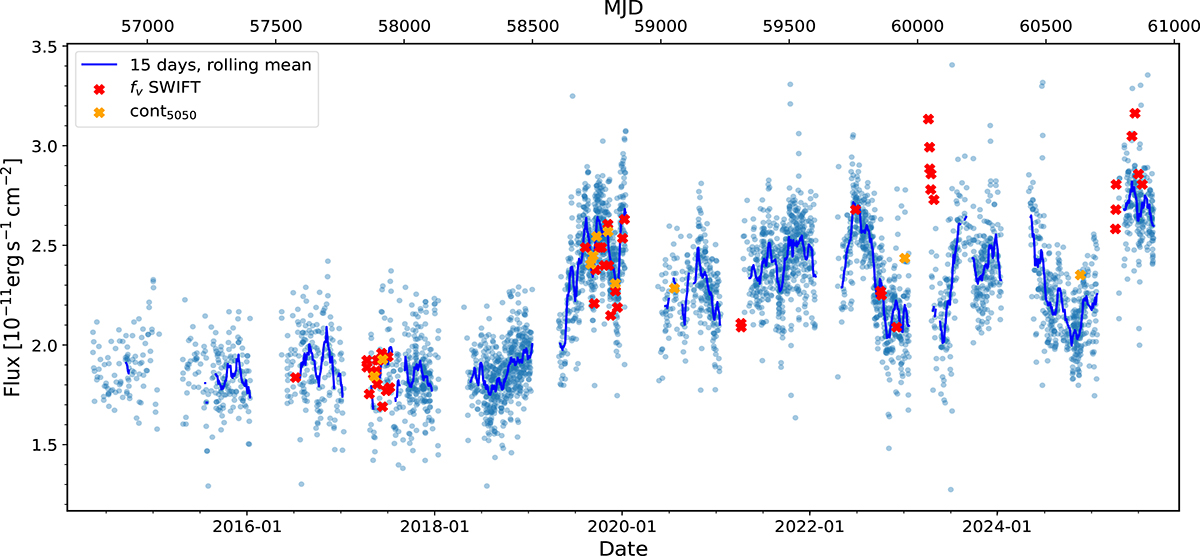
Optical light curve of IRAS 23226-3843 based on ASAS-SN data for the years 2014–2025. In addition we show the SwiftV-band fluxes (red crosses) as well as the continuum fluxes at 5050 Å based on our optical spectra (orange crosses).
Current usage metrics show cumulative count of Article Views (full-text article views including HTML views, PDF and ePub downloads, according to the available data) and Abstracts Views on Vision4Press platform.
Data correspond to usage on the plateform after 2015. The current usage metrics is available 48-96 hours after online publication and is updated daily on week days.
Initial download of the metrics may take a while.