Open Access
Fig. 5.
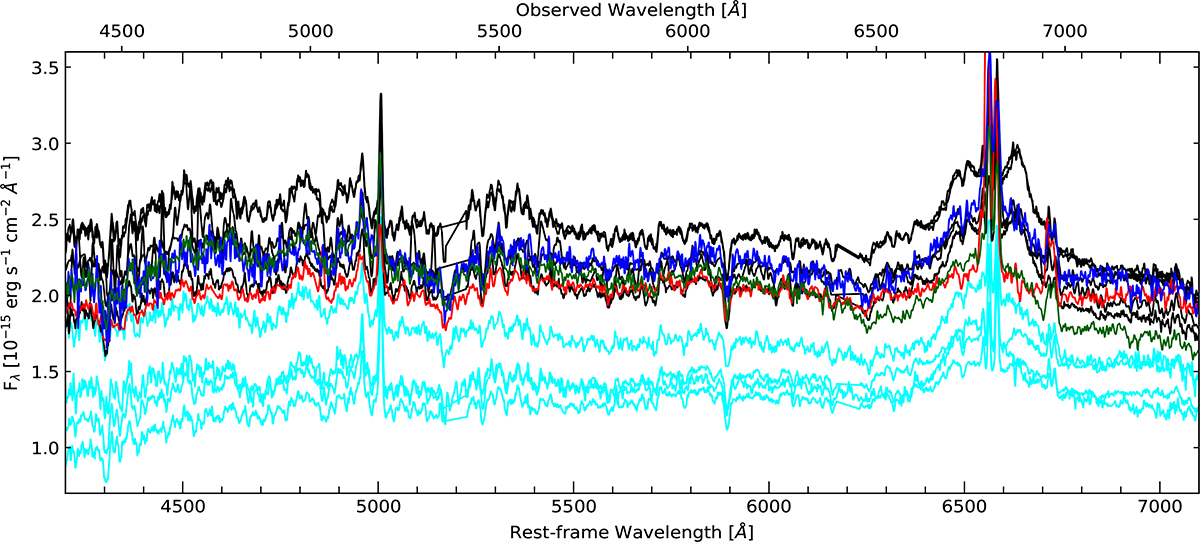
Download original image
Optical spectra of IRAS 23226-3843 for the years 1997 until 2024. The decreasing spectra from 1997 until 2017 are shown in cyan. The spectra taken during the outburst in 2019 are shown in black. The latest spectra are shown in red (2020), blue (2023), and green (2024).
Current usage metrics show cumulative count of Article Views (full-text article views including HTML views, PDF and ePub downloads, according to the available data) and Abstracts Views on Vision4Press platform.
Data correspond to usage on the plateform after 2015. The current usage metrics is available 48-96 hours after online publication and is updated daily on week days.
Initial download of the metrics may take a while.