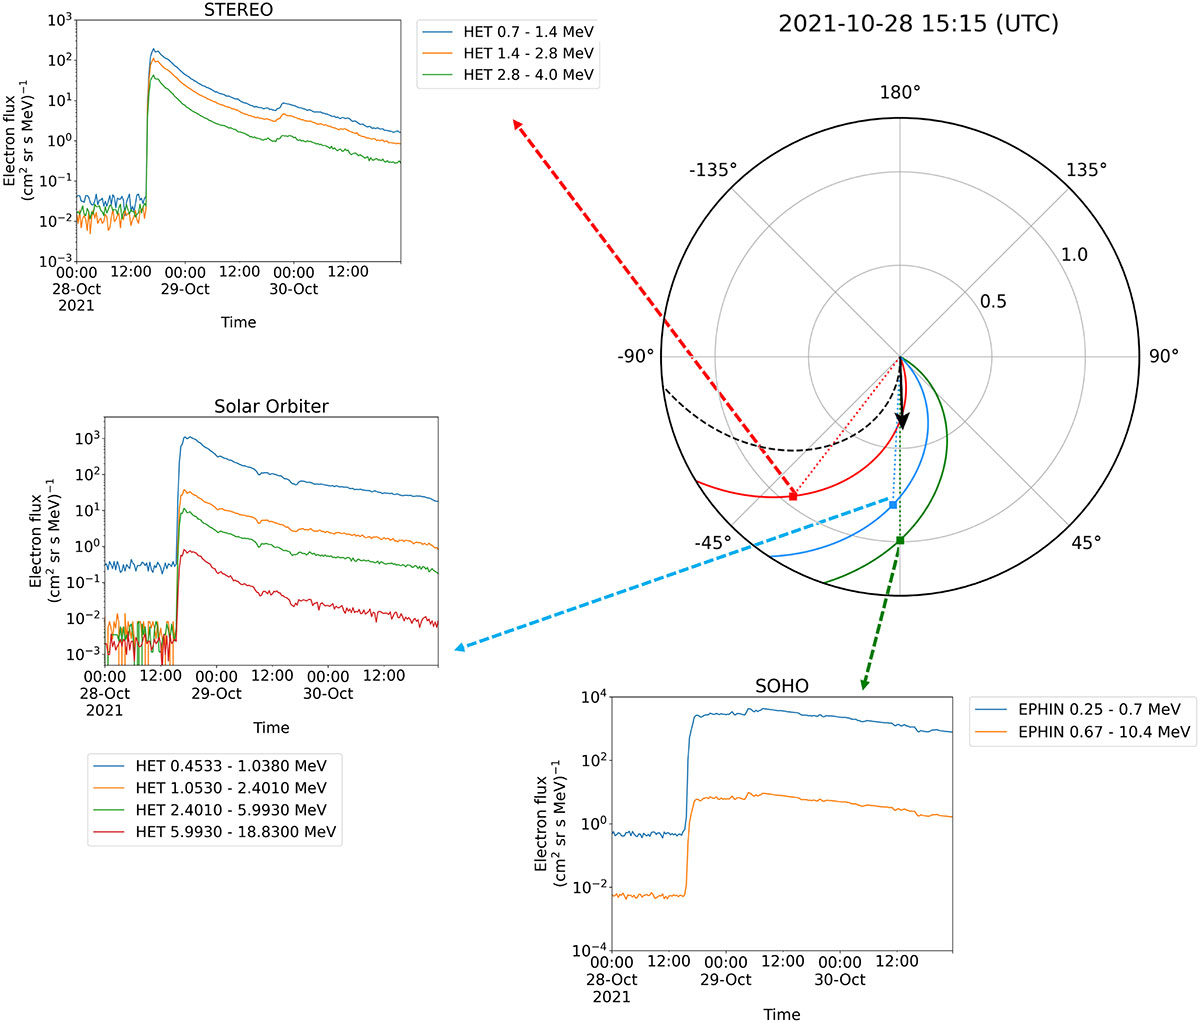
Fig. 1.
Download original image
View of the ecliptic plane (top right) from solar north showing the positions of various spacecraft, and their respective Parker spirals, on 28 October 2021 at 15:15 UT. The black arrow and dashed black curve show the flare reference location and corresponding Parker spiral. The insets show the electron flux intensity time series for each corresponding spacecraft. The top right figure is derived from the Solar MAgnetic Connection Haus tool (https://solar-mach.github.io/; Gieseler et al. 2023).
Current usage metrics show cumulative count of Article Views (full-text article views including HTML views, PDF and ePub downloads, according to the available data) and Abstracts Views on Vision4Press platform.
Data correspond to usage on the plateform after 2015. The current usage metrics is available 48-96 hours after online publication and is updated daily on week days.
Initial download of the metrics may take a while.