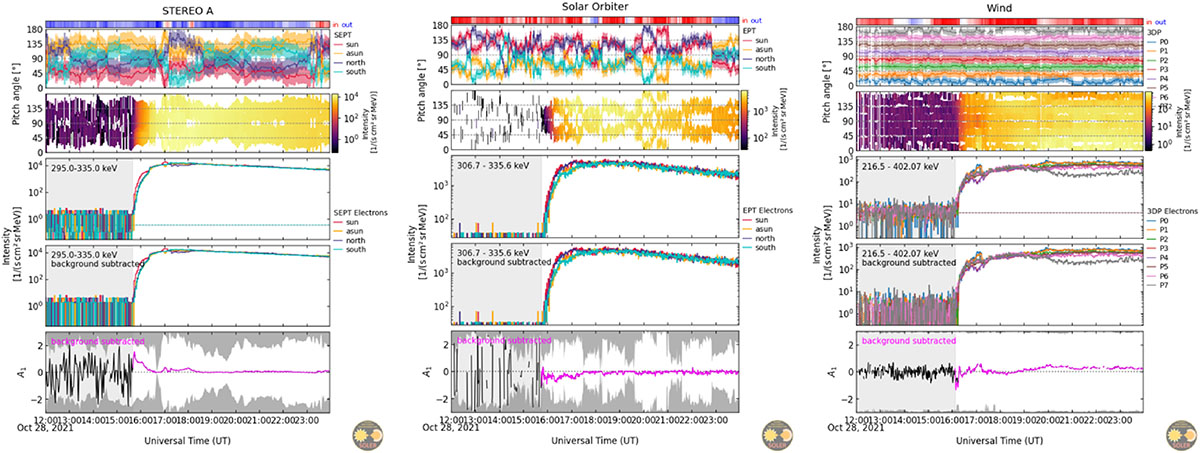
Fig. B.1.
Download original image
PAD and anisotropy for (from left to right) STA/SEPT ∼314 keV, SolO/SEPT ∼321 keV, and Wind/3DP ∼310 keV electrons. In each figure (for each observer), the top panel represents the inward (in red) and outward (in blue) polarity, the second panel depicts the PADs, the third panel shows the sectored intensities in all the available directions, the fourth panel shows the sectored intensities but with background subtraction, and the fifth panel presents the anisotropy. All figures were created with the SEP tools of the SOLER project (Gieseler et al. 2025).
Current usage metrics show cumulative count of Article Views (full-text article views including HTML views, PDF and ePub downloads, according to the available data) and Abstracts Views on Vision4Press platform.
Data correspond to usage on the plateform after 2015. The current usage metrics is available 48-96 hours after online publication and is updated daily on week days.
Initial download of the metrics may take a while.