Fig. 4.
Download original image
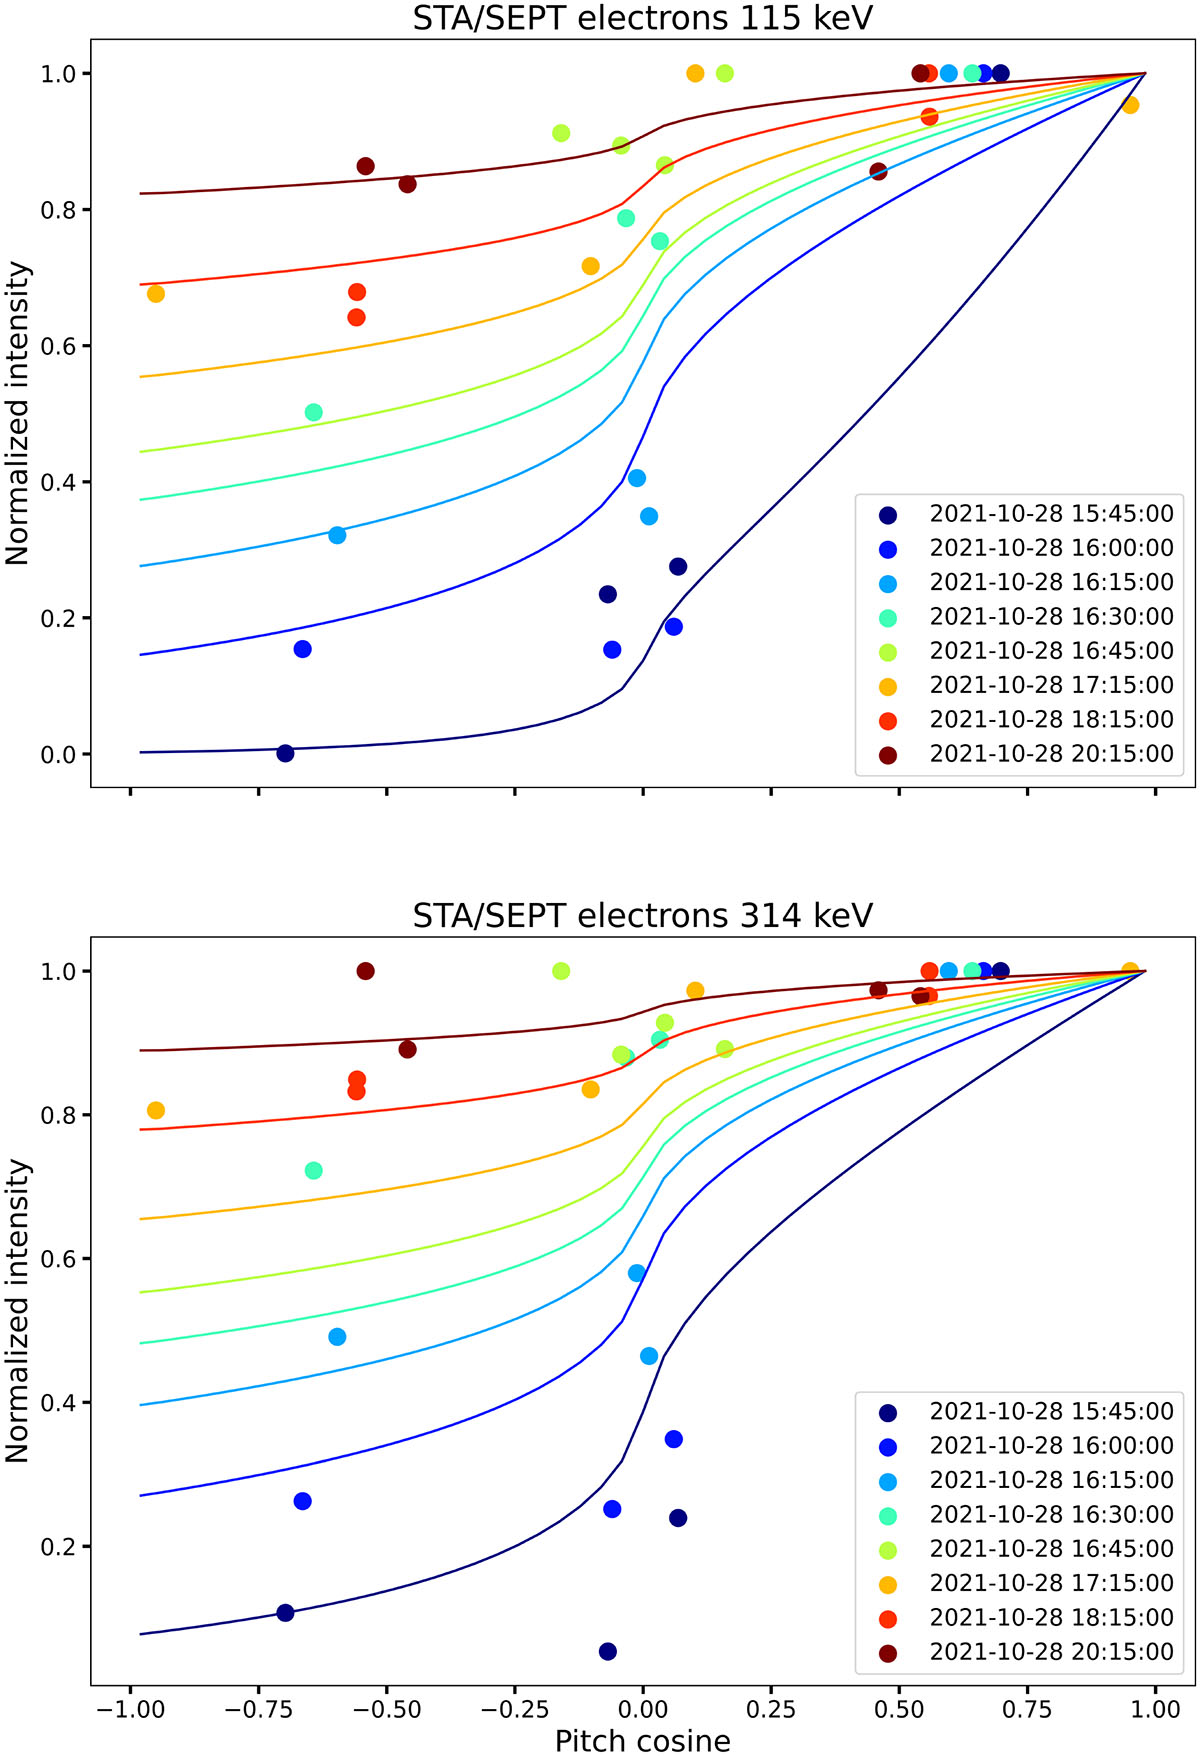
Evolution of PAD for 115 and 314 keV electrons, from ∼0.5 h (dark blue) to 5 h (brown) after the injection. Actual measurements from the four STA/SEPT sectors are depicted as circles and the corresponding simulated PADs as solid lines with the same color. The color-coding of the successive timestamps is explained in the legend.
Current usage metrics show cumulative count of Article Views (full-text article views including HTML views, PDF and ePub downloads, according to the available data) and Abstracts Views on Vision4Press platform.
Data correspond to usage on the plateform after 2015. The current usage metrics is available 48-96 hours after online publication and is updated daily on week days.
Initial download of the metrics may take a while.