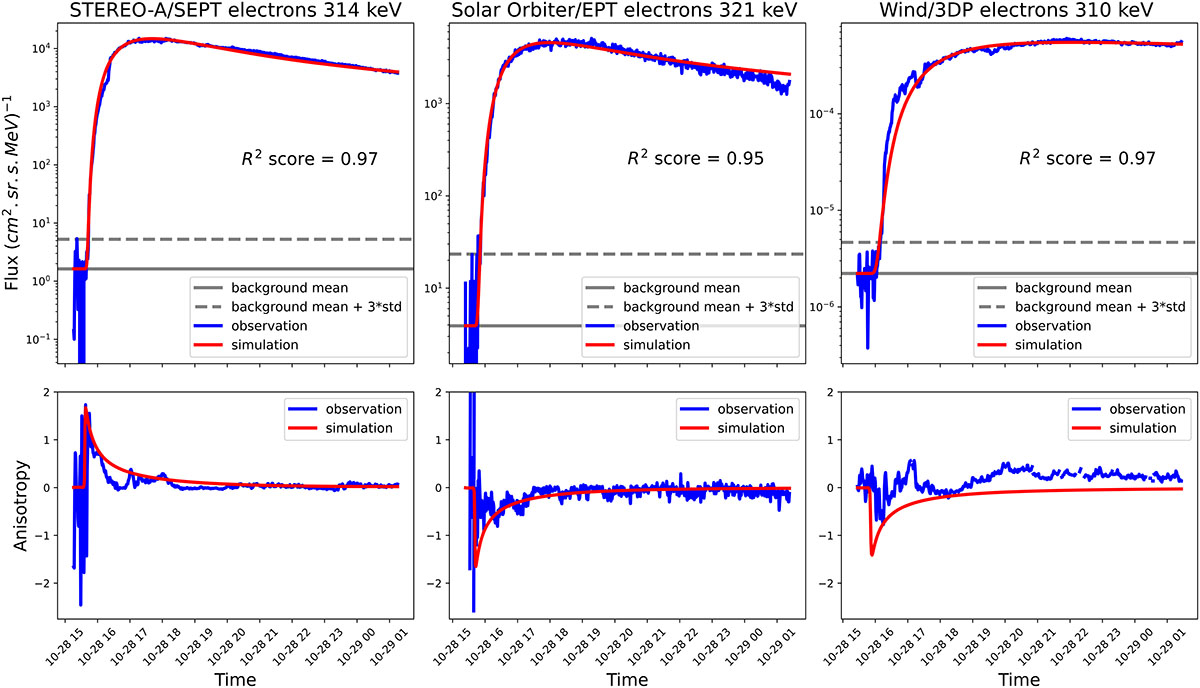
Fig. 5.
Download original image
Inverse solution to particle flux (top) and anisotropy (bottom) of three observers (left: STA/SEPT, middle: Solar Orbiter/EPT, right: Wind/3DP) for ∼314 keV electrons. The observed particle fluxes and anisotropies are depicted in blue and the simulated ones in red. The solid gray line in the flux profiles indicates the background level and the dashed line the background level plus 3σ. Simulated anisotropies have been reversed for Solar Orbiter and Wind, which were in an opposite polarity HMF to STEREO (see Fig. B.1 in the Appendix).
Current usage metrics show cumulative count of Article Views (full-text article views including HTML views, PDF and ePub downloads, according to the available data) and Abstracts Views on Vision4Press platform.
Data correspond to usage on the plateform after 2015. The current usage metrics is available 48-96 hours after online publication and is updated daily on week days.
Initial download of the metrics may take a while.