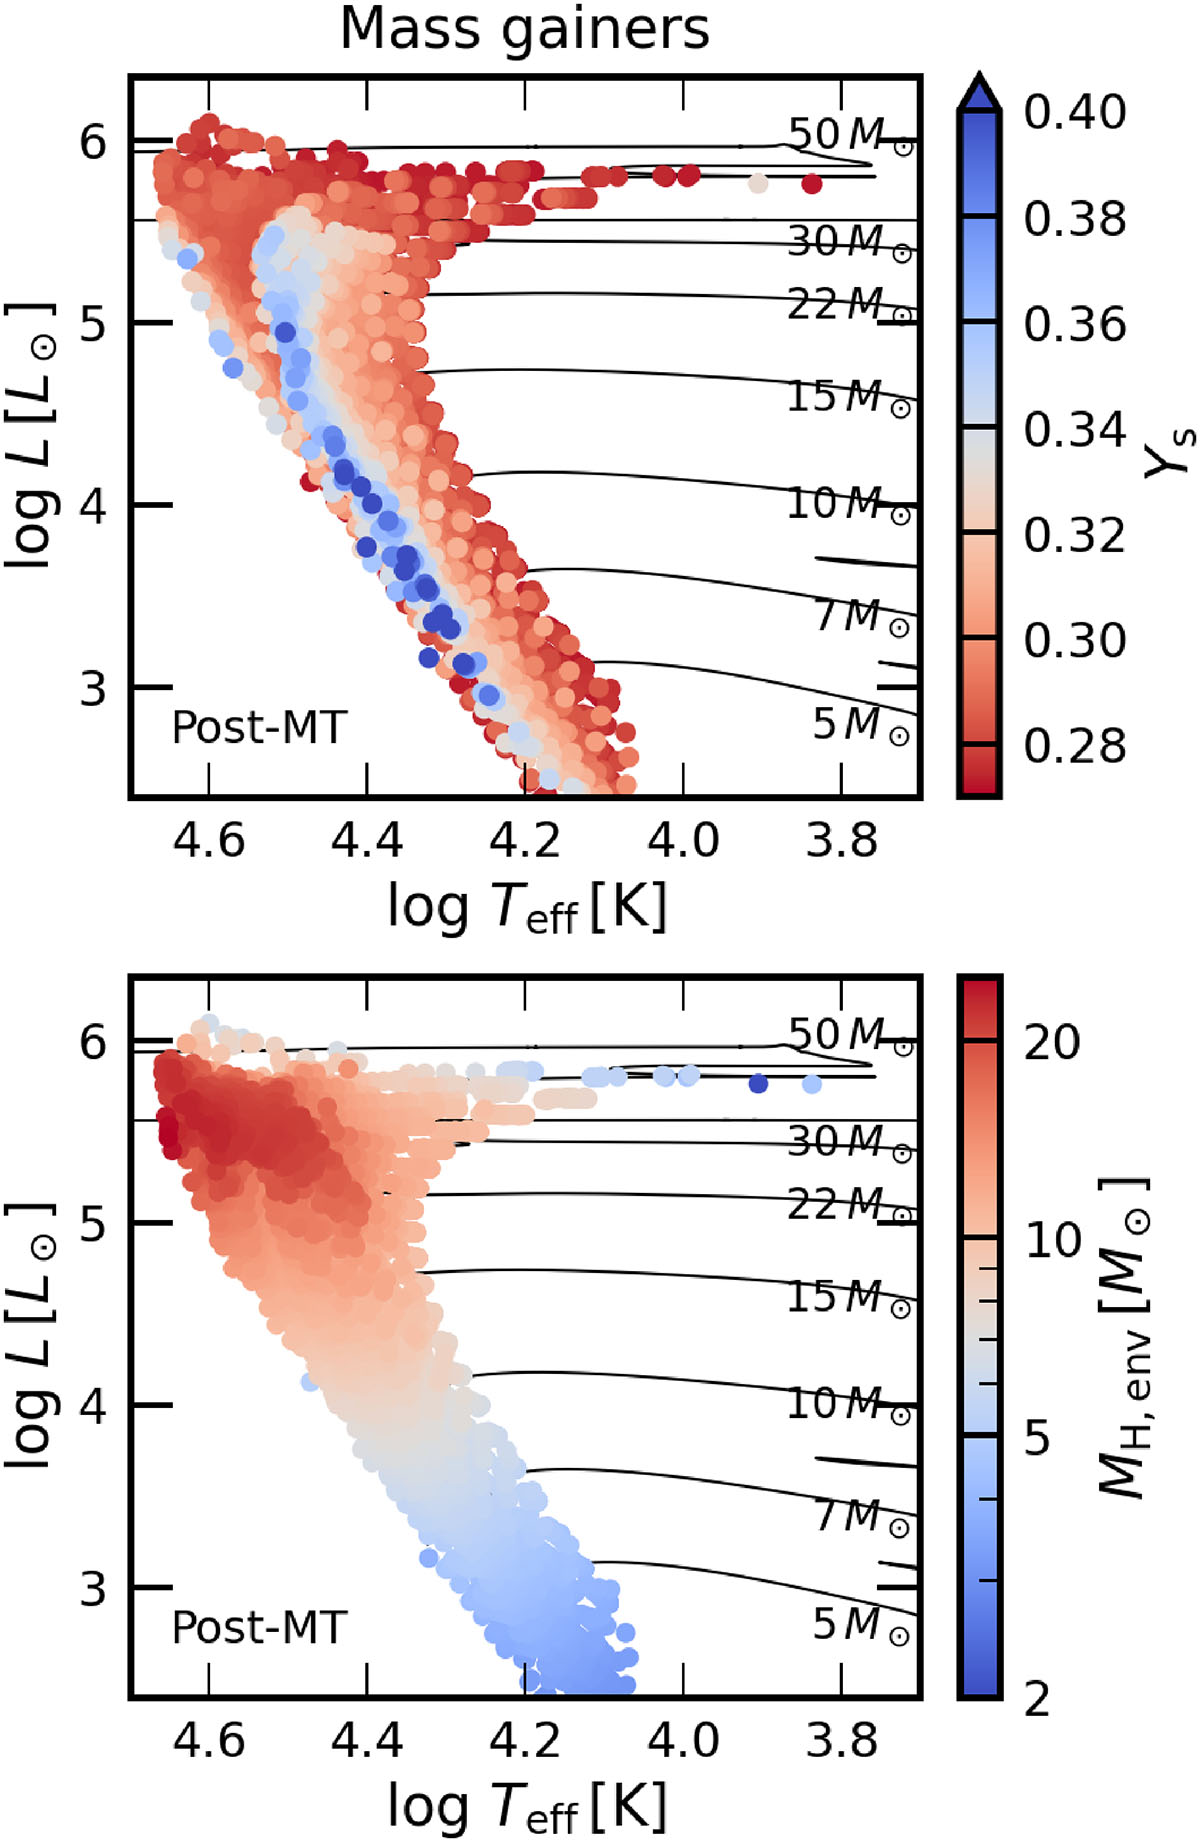
Fig. 3.
Download original image
Locations of core hydrogen burning mass gainers after thermal relaxation (see text) in the HRD. Thus, each data point represents one model sequence at a specific evolutionary stage. The color coding represents surface helium mass fraction (top) and current hydrogen envelope mass (bottom), which is defined as the total mass subtracted by the helium core mass. Black lines represent evolutionary tracks for non-rotating single-star models with their initial mass indicated.
Current usage metrics show cumulative count of Article Views (full-text article views including HTML views, PDF and ePub downloads, according to the available data) and Abstracts Views on Vision4Press platform.
Data correspond to usage on the plateform after 2015. The current usage metrics is available 48-96 hours after online publication and is updated daily on week days.
Initial download of the metrics may take a while.