Fig. 6.
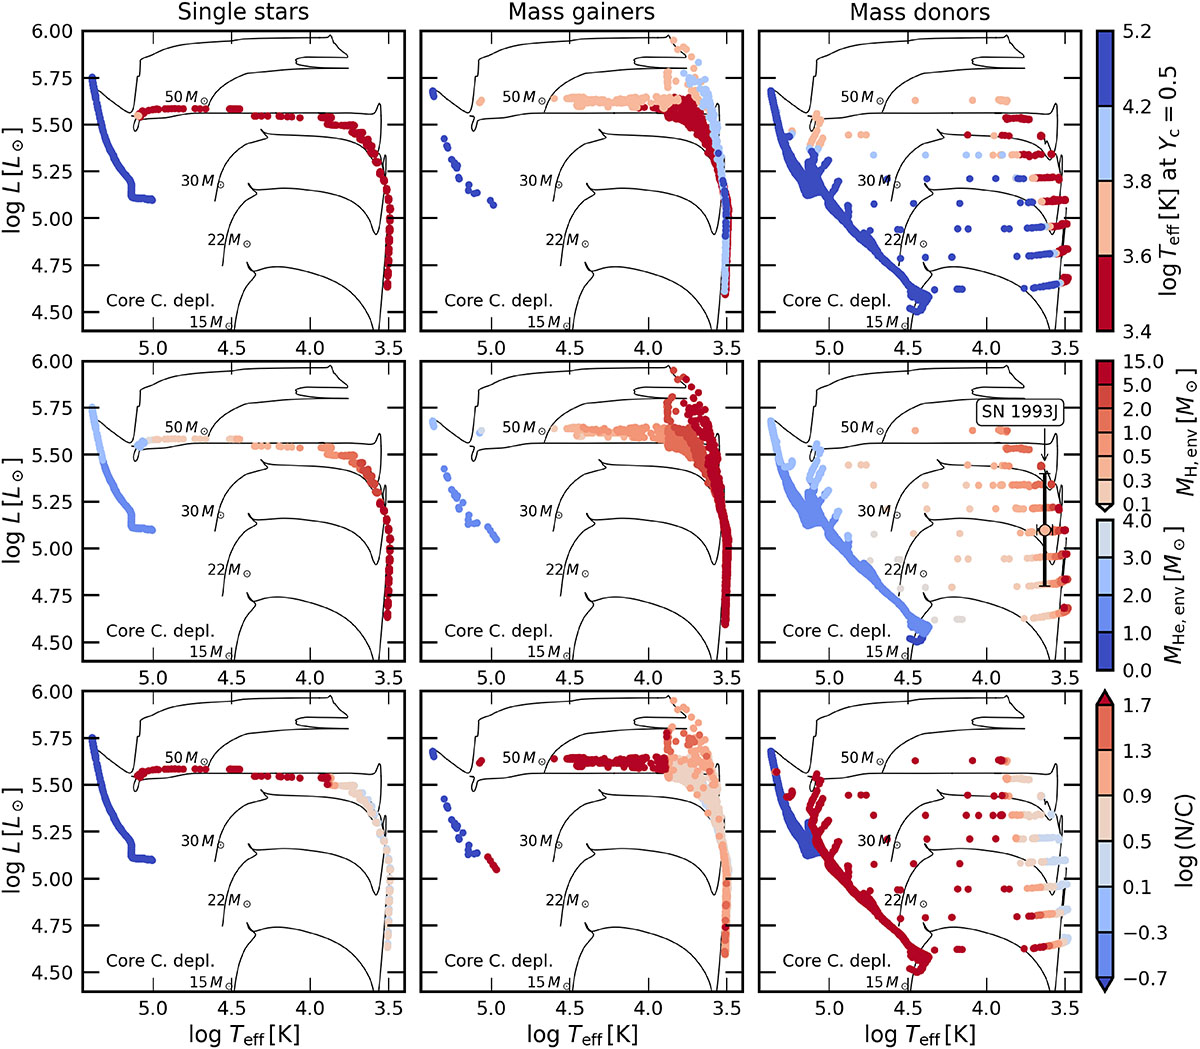
Download original image
Single stars (left), mass gainers (middle), and mass donors (right) in the HRD at core carbon depletion, which represents the pre-supernova stage well. The color coding represents the effective temperature at the midpoint of core helium burning (Yc = 0.5), the remaining hydrogen and helium envelope mass, and the nitrogen-to-carbon ratio, from top to bottom. Data points are stacked such that those with higher log Teff, Menv, log(N/C) appear above those with lower values. Evolutionary tracks for non-rotating single-star models are also presented with their initial mass indicated. In the mass donor panel on the second row, the data point for SN 1993J progenitor is also shown (Maund et al. 2004).
Current usage metrics show cumulative count of Article Views (full-text article views including HTML views, PDF and ePub downloads, according to the available data) and Abstracts Views on Vision4Press platform.
Data correspond to usage on the plateform after 2015. The current usage metrics is available 48-96 hours after online publication and is updated daily on week days.
Initial download of the metrics may take a while.