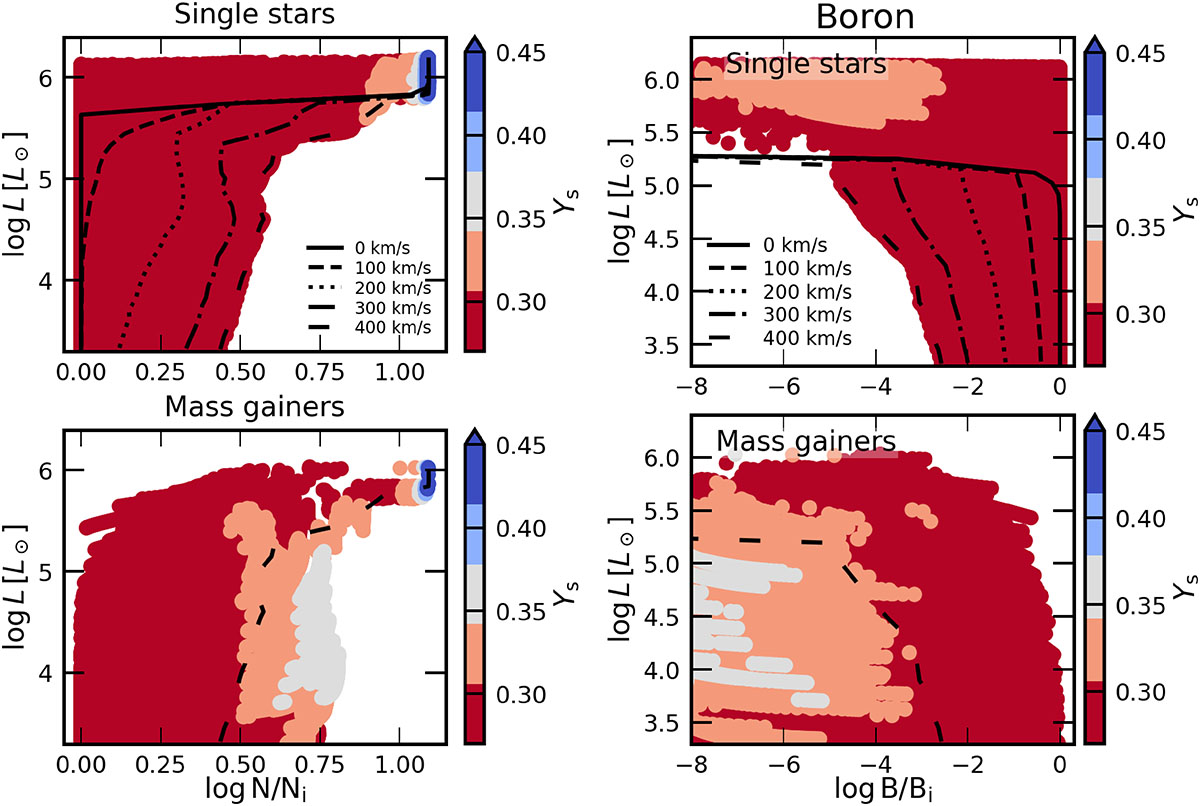
Fig. 7.
Download original image
Surface elemental abundances of main sequence stars as a function of luminosity for nitrogen (left) and boron (right). The upper panels show single stars, while the lower panels show mass gainers. The x-axis represents log(N/Ni), where N is the elemental number fraction and Ni is the initial value. Abundances are sampled at 0.1 Myr intervals for all models within the main sequence band during the core hydrogen burning phase. Data points are stacked such that those with higher Ys appear above those with lower Ys. For single stars, lines indicate the limits for different initial rotational velocities. For mass gainers, the line for 400 km s−1 is shown.
Current usage metrics show cumulative count of Article Views (full-text article views including HTML views, PDF and ePub downloads, according to the available data) and Abstracts Views on Vision4Press platform.
Data correspond to usage on the plateform after 2015. The current usage metrics is available 48-96 hours after online publication and is updated daily on week days.
Initial download of the metrics may take a while.