Open Access
Fig. 1
Download original image
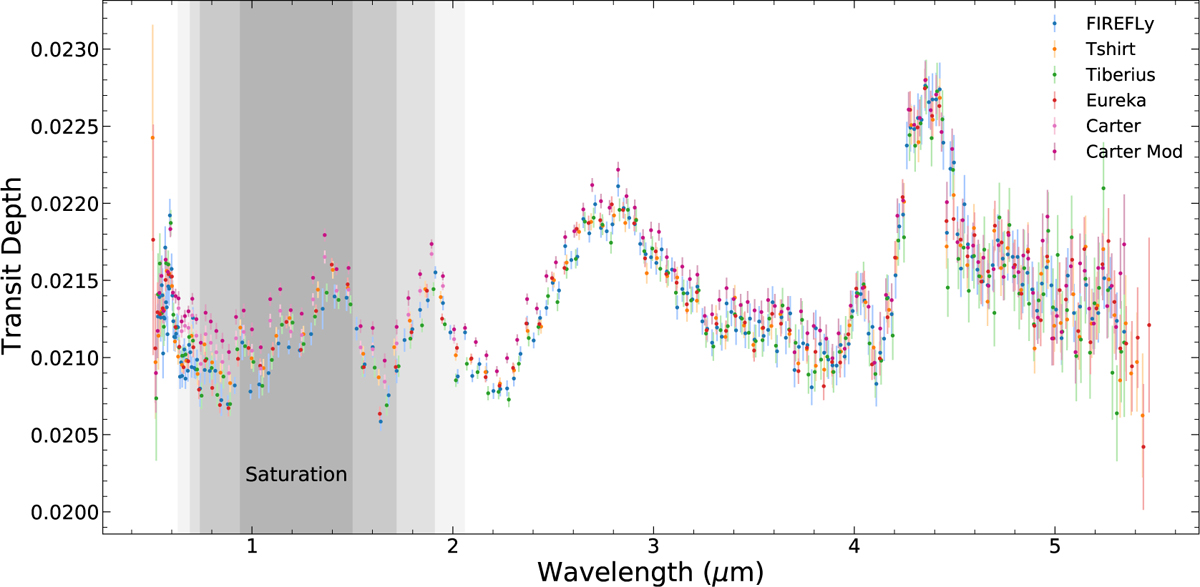
Representation of the different spectral data used for the purpose of this work. The gray shades in the 0.63-2.06 micron range are related to the level of saturation: for the lightest region, only one group per integration was affected by saturation, while for the darkest region, up to four of the five groups were affected.
Current usage metrics show cumulative count of Article Views (full-text article views including HTML views, PDF and ePub downloads, according to the available data) and Abstracts Views on Vision4Press platform.
Data correspond to usage on the plateform after 2015. The current usage metrics is available 48-96 hours after online publication and is updated daily on week days.
Initial download of the metrics may take a while.