Open Access
Fig. 2
Download original image
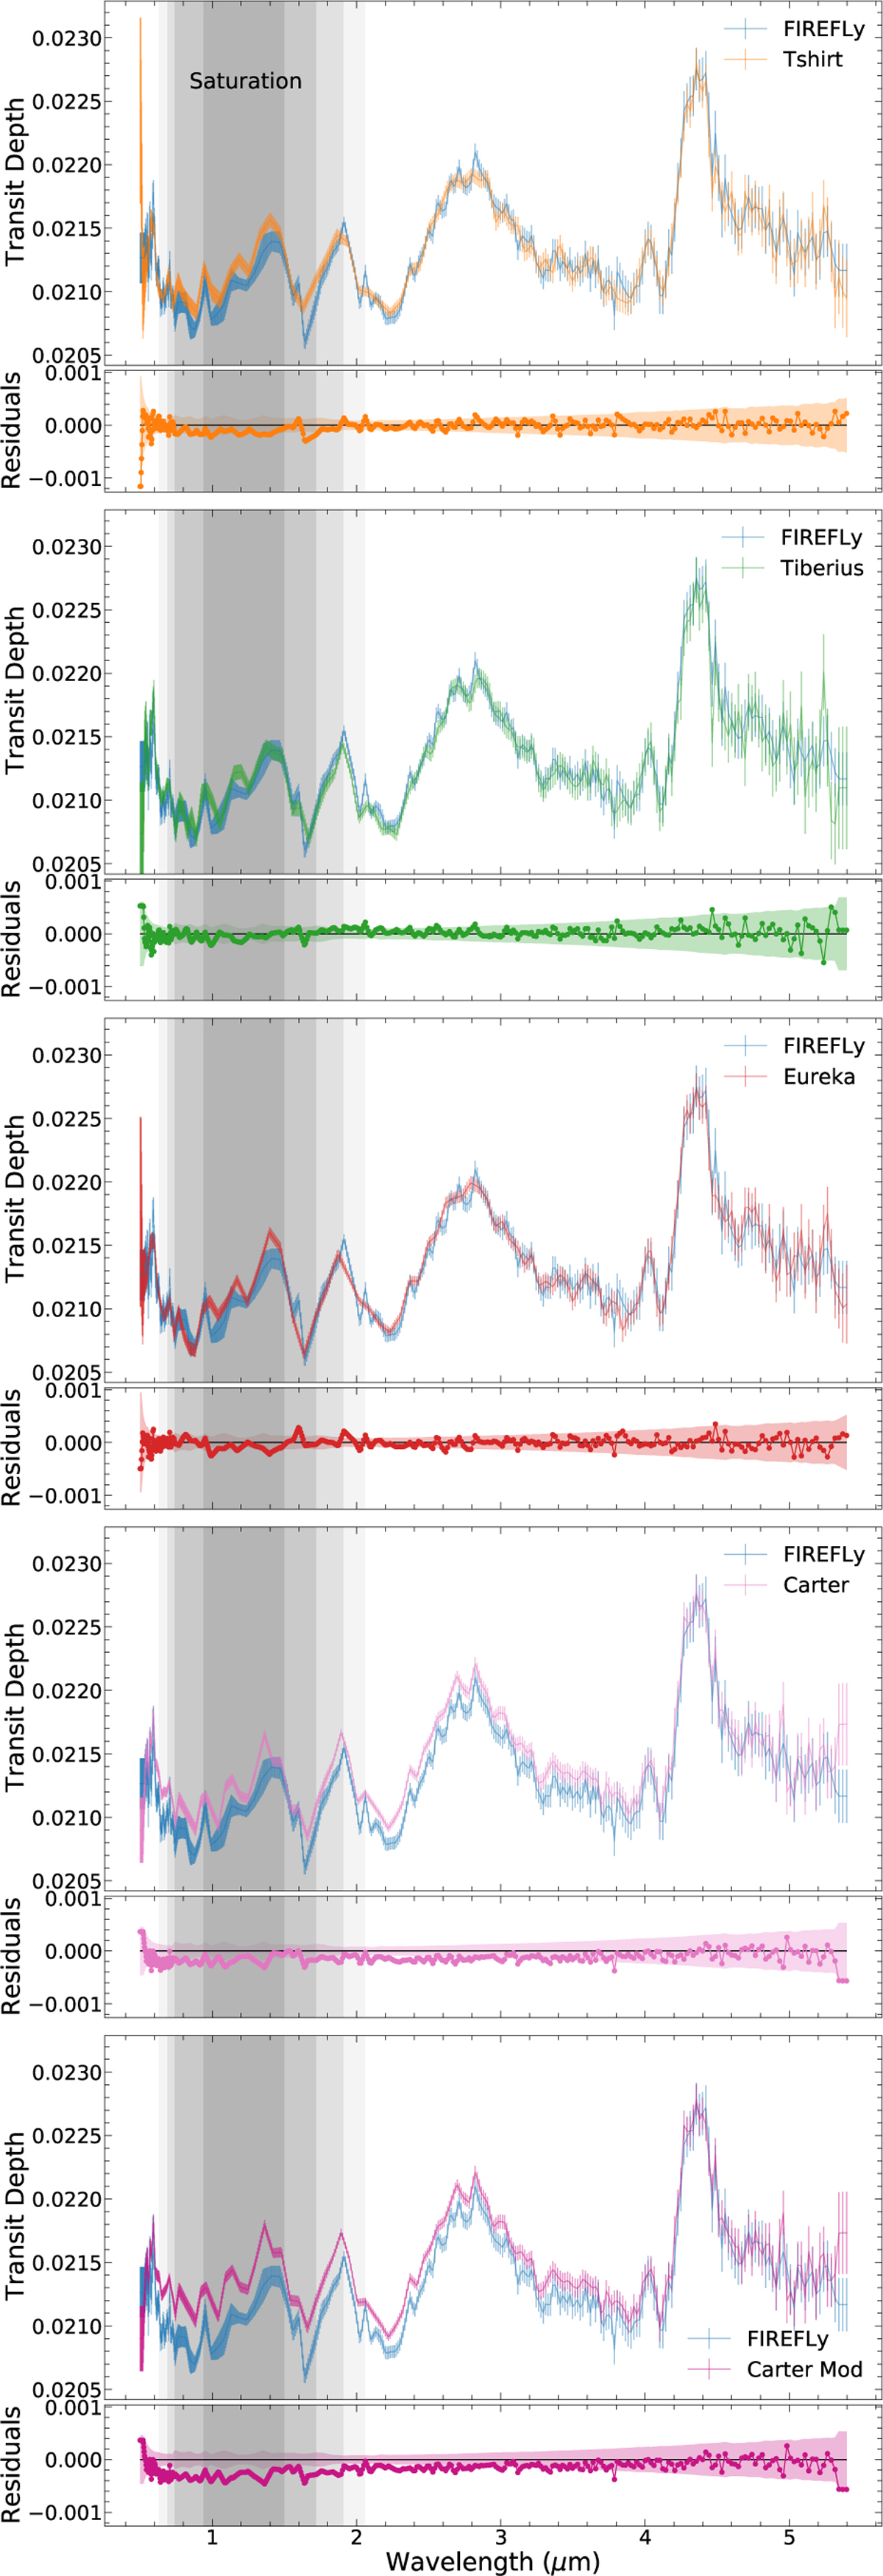
Comparison of the spectra with the FIREFLy data reduction as a reference and their respective residuals. Coloured regions at the residuals represent error bar propagation. Grey regions show the saturated spectral range (0.63-2.06 μm) as in Fig. 1.
Current usage metrics show cumulative count of Article Views (full-text article views including HTML views, PDF and ePub downloads, according to the available data) and Abstracts Views on Vision4Press platform.
Data correspond to usage on the plateform after 2015. The current usage metrics is available 48-96 hours after online publication and is updated daily on week days.
Initial download of the metrics may take a while.