Fig. 5
Download original image
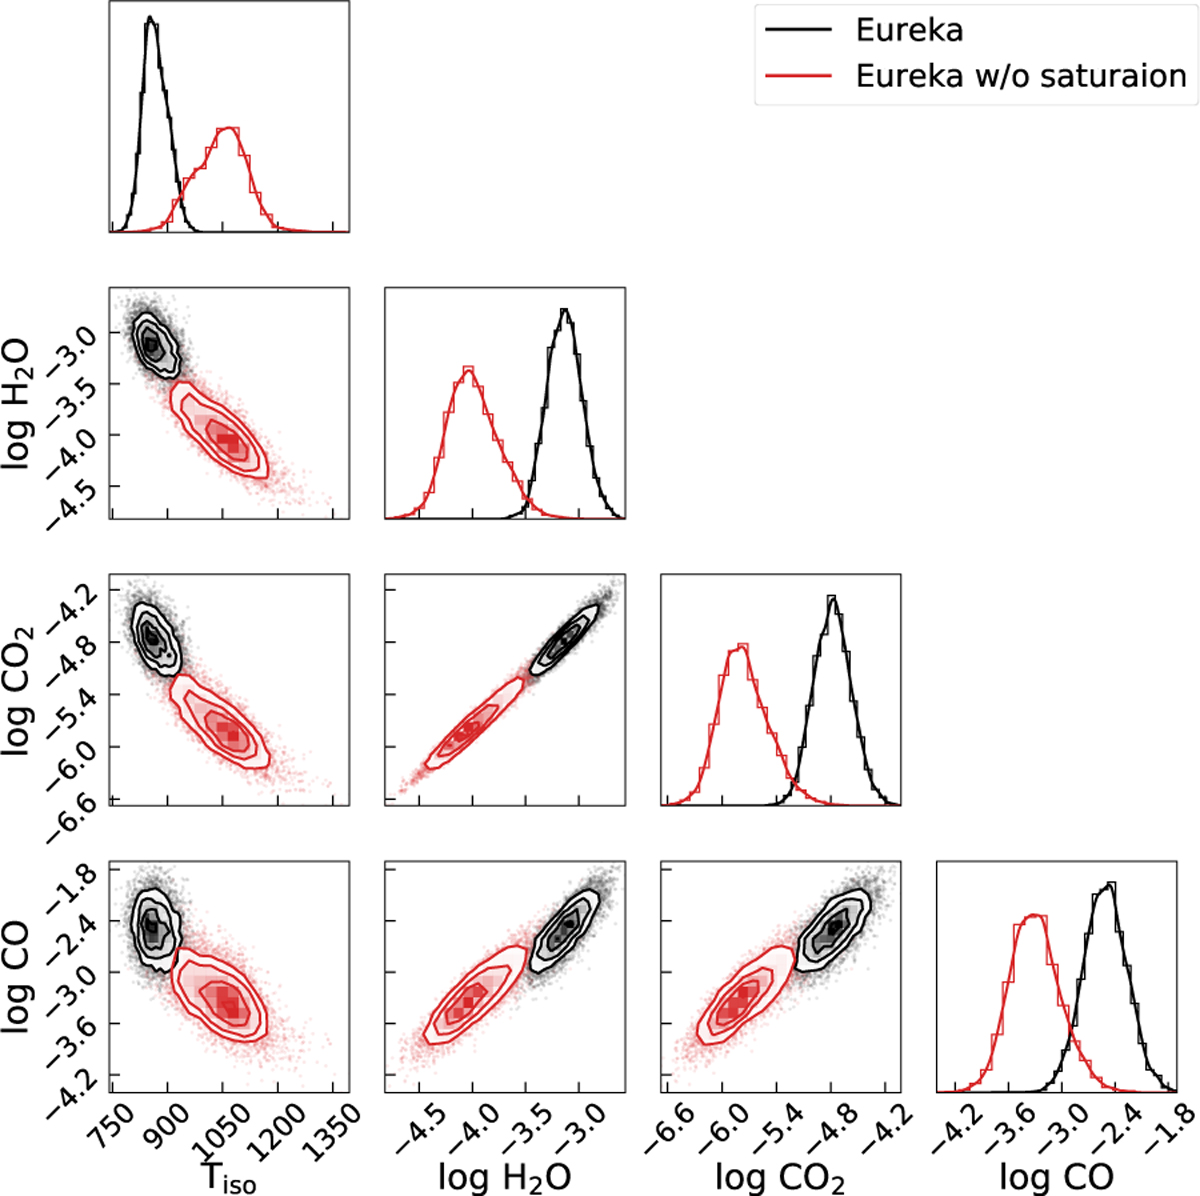
Partial corner plot extracted from Fig. A.4, using Eureka spectrum as the input for the retrievals. Black areas are used for the results including the whole spectral range, while red is used for those excluding the saturated 0.69-1.91 μm range. The temperature shows negative correlations with molecular abundances, while the abundances of H2O, CO2 and CO are positively correlated with each other.
Current usage metrics show cumulative count of Article Views (full-text article views including HTML views, PDF and ePub downloads, according to the available data) and Abstracts Views on Vision4Press platform.
Data correspond to usage on the plateform after 2015. The current usage metrics is available 48-96 hours after online publication and is updated daily on week days.
Initial download of the metrics may take a while.