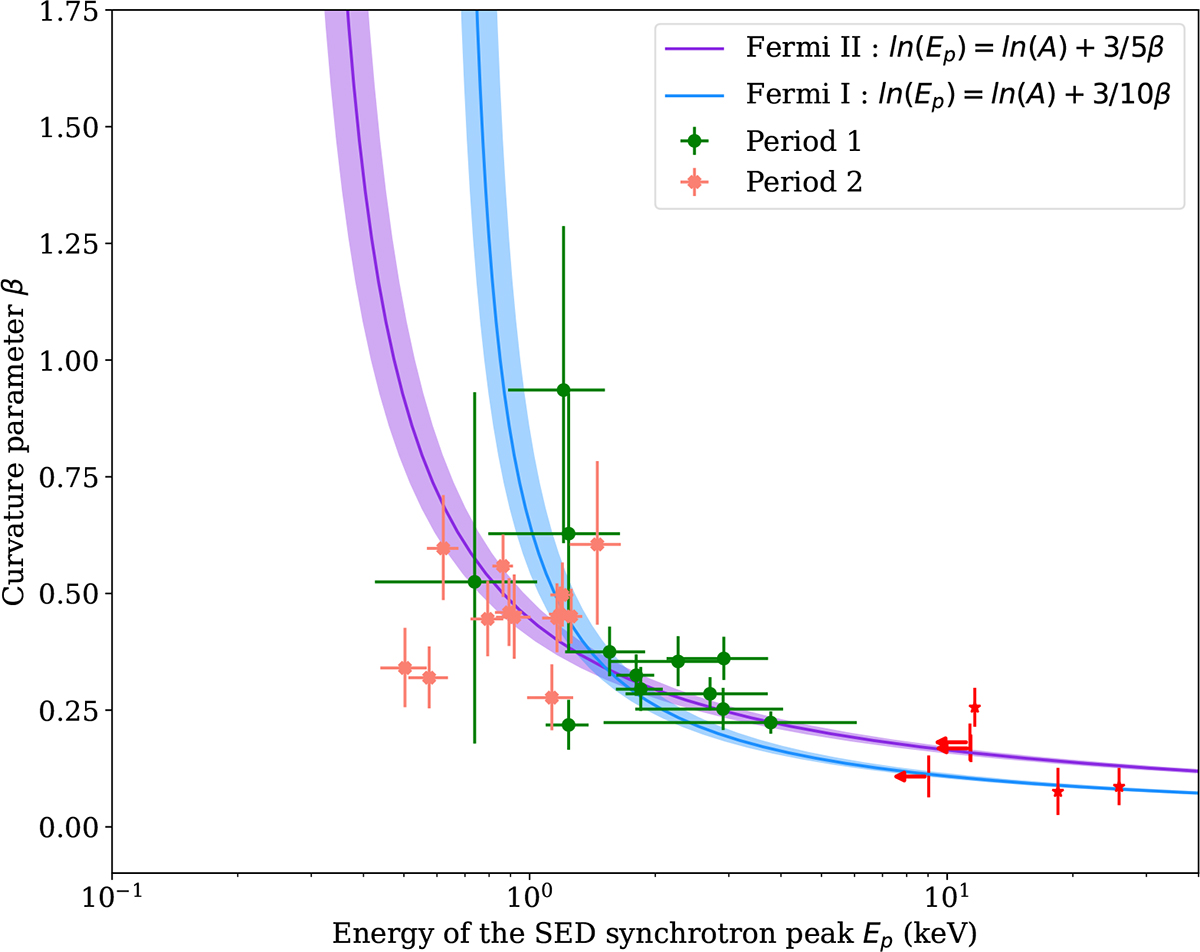
Fig. 3.
Download original image
Distribution in the Ep − β plane for the period 1 and 2 combined. Purple and blue lines indicate expectations for Fermi II and Fermi I acceleration, respectively, fit using data from period 1 with an additional multiplicative constant. The colored regions represent 1σ errors. Red stars represent unconstrained points, whereas red triangles represent 1σ upper limits. Errors on Ep at the 1σ level were obtained through error propagation from the 1σ uncertainties on α and β. When the lower bound of the confidence interval included zero, we treated the value as a 1σ upper limit. We also considered values unconstrained when their uncertainties were at least one order of magnitude larger than the measured value itself, and when both limits of the confidence interval were poorly constrained.
Current usage metrics show cumulative count of Article Views (full-text article views including HTML views, PDF and ePub downloads, according to the available data) and Abstracts Views on Vision4Press platform.
Data correspond to usage on the plateform after 2015. The current usage metrics is available 48-96 hours after online publication and is updated daily on week days.
Initial download of the metrics may take a while.